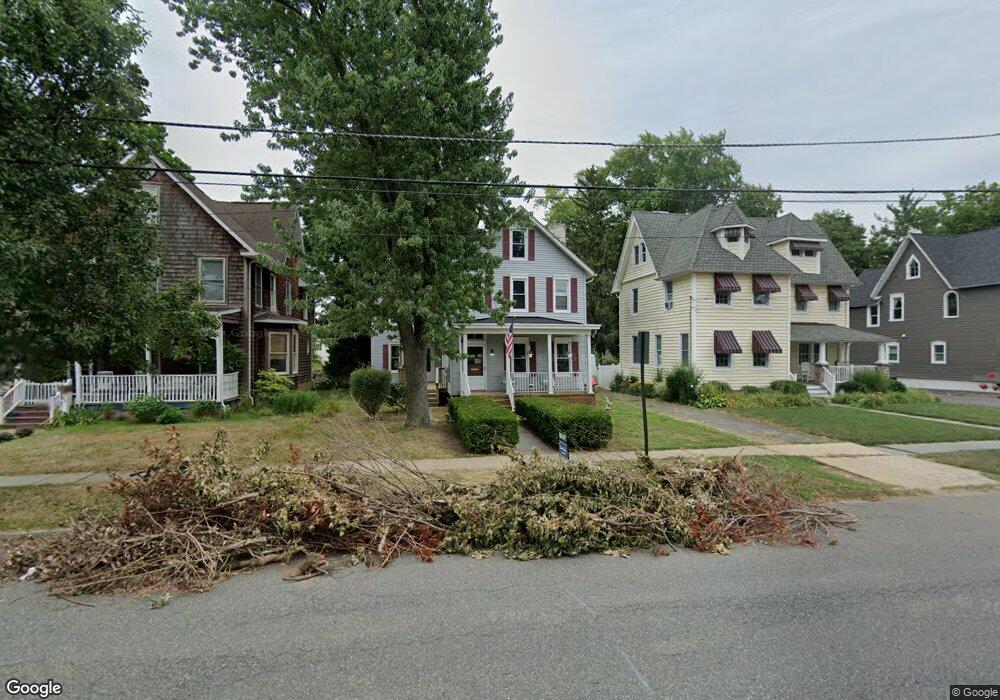
52 Broad St Freehold, NJ 07728
Estimated Value: $553,000 - $747,000
5
Beds
4
Baths
2,284
Sq Ft
$283/Sq Ft
Est. Value
About This Home
This home is located at 52 Broad St, Freehold, NJ 07728 and is currently estimated at $645,550, approximately $282 per square foot. 52 Broad St is a home located in Monmouth County with nearby schools including Park Avenue Elementary School, Freehold Intermediate School, and Freehold Borough High School.
Ownership History
Date
Name
Owned For
Owner Type
Purchase Details
Closed on
Dec 23, 2021
Sold by
Dickenson Christine M
Bought by
Heffernan Scott
Current Estimated Value
Home Financials for this Owner
Home Financials are based on the most recent Mortgage that was taken out on this home.
Original Mortgage
$177,968
Outstanding Balance
$162,872
Interest Rate
3.05%
Mortgage Type
New Conventional
Estimated Equity
$482,678
Create a Home Valuation Report for This Property
The Home Valuation Report is an in-depth analysis detailing your home's value as well as a comparison with similar homes in the area
Home Values in the Area
Average Home Value in this Area
Purchase History
| Date | Buyer | Sale Price | Title Company |
|---|---|---|---|
| Heffernan Scott | $225,550 | Trident Abstract Title |
Source: Public Records
Mortgage History
| Date | Status | Borrower | Loan Amount |
|---|---|---|---|
| Open | Heffernan Scott | $177,968 |
Source: Public Records
Tax History
| Year | Tax Paid | Tax Assessment Tax Assessment Total Assessment is a certain percentage of the fair market value that is determined by local assessors to be the total taxable value of land and additions on the property. | Land | Improvement |
|---|---|---|---|---|
| 2025 | $9,403 | $468,200 | $253,200 | $215,000 |
| 2024 | $8,352 | $468,500 | $241,700 | $226,800 |
| 2023 | $8,352 | $398,300 | $188,400 | $209,900 |
| 2022 | $7,687 | $345,700 | $154,600 | $191,100 |
| 2021 | $7,687 | $302,600 | $128,800 | $173,800 |
| 2020 | $7,840 | $294,500 | $128,800 | $165,700 |
| 2019 | $7,672 | $289,500 | $128,800 | $160,700 |
| 2018 | $7,738 | $286,500 | $128,800 | $157,700 |
| 2017 | $7,716 | $284,500 | $128,800 | $155,700 |
| 2016 | $8,475 | $319,200 | $134,300 | $184,900 |
| 2015 | $8,225 | $324,600 | $139,700 | $184,900 |
| 2014 | $7,852 | $324,600 | $139,700 | $184,900 |
Source: Public Records
Map
Nearby Homes
Your Personal Tour Guide
Ask me questions while you tour the home.