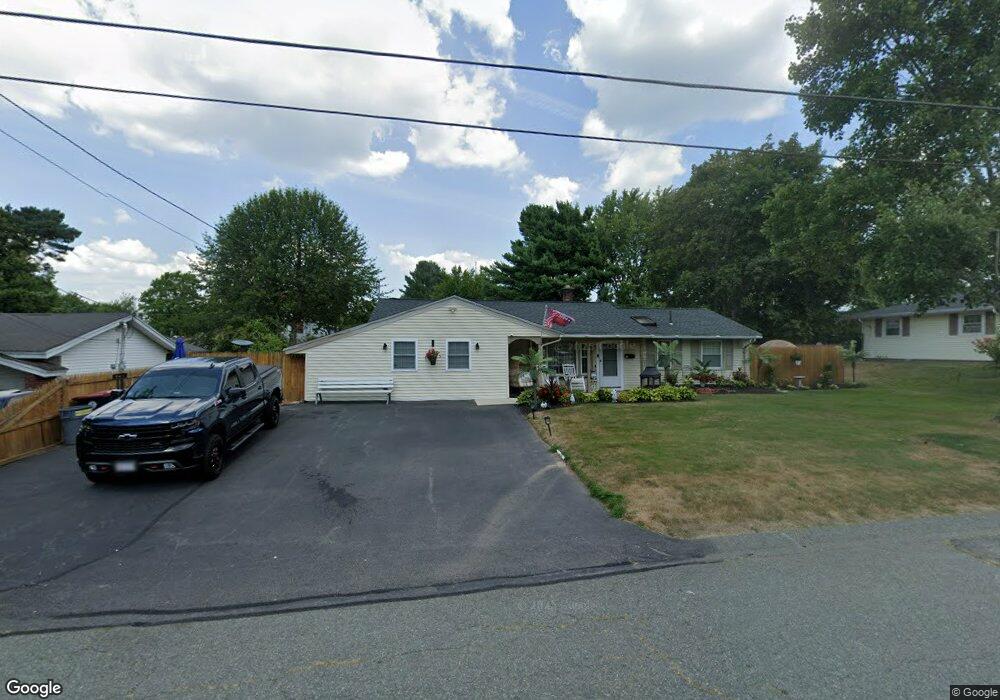
52 Brookfield Dr Brockton, MA 02302
Montello NeighborhoodEstimated Value: $479,000 - $519,000
About This Home
This home is located at 52 Brookfield Dr, Brockton, MA 02302 and is currently estimated at $498,264, approximately $316 per square foot. 52 Brookfield Dr is a home located in Plymouth County with nearby schools including Brookfield Elementary School, Mary E. Baker Elementary School, and Downey Elementary School.
Ownership History
We collect this data history from publicly available records. To have your information removed, we recommend requesting removal directly through your county’s website.
Purchase Details
Purchase Details
Home Financials for this Owner
Home Financials are based on the most recent Mortgage that was taken out on this home.Purchase Details
Home Financials for this Owner
Home Financials are based on the most recent Mortgage that was taken out on this home.Purchase Details
Home Values in the Area
Average Home Value in this Area
Purchase History
We collect this data history from publicly available records. To have your information removed, we recommend requesting removal directly through your county’s website.
| Date | Buyer | Sale Price | Title Company |
|---|---|---|---|
| -- | -- | ||
| -- | -- | ||
| $171,000 | -- | ||
| $171,000 | -- | ||
| $101,000 | -- | ||
| $101,000 | -- | ||
| $101,000 | -- | ||
| $96,000 | -- | ||
| $96,000 | -- |
Mortgage History
We collect this data history from publicly available records. To have your information removed, we recommend requesting removal directly through your county’s website.
| Date | Status | Borrower | Loan Amount |
|---|---|---|---|
| Previous Owner | $162,450 | ||
| Previous Owner | $130,226 |
Tax History
We collect this data history from publicly available records. To have your information removed, we recommend requesting removal directly through your county’s website.
| Year | Tax Paid | Tax Assessment Tax Assessment Total Assessment is a certain percentage of the fair market value that is determined by local assessors to be the total taxable value of land and additions on the property. | Land | Improvement |
|---|---|---|---|---|
| 2025 | $4,776 | $394,400 | $159,700 | $234,700 |
| 2024 | $4,678 | $389,200 | $159,700 | $229,500 |
| 2023 | $4,482 | $345,300 | $110,000 | $235,300 |
| 2022 | $4,092 | $292,900 | $100,000 | $192,900 |
| 2021 | $3,957 | $272,900 | $92,700 | $180,200 |
| 2020 | $4,006 | $264,400 | $81,400 | $183,000 |
| 2019 | $3,624 | $233,200 | $77,600 | $155,600 |
| 2018 | $3,577 | $222,700 | $77,600 | $145,100 |
| 2017 | $3,152 | $195,800 | $77,600 | $118,200 |
| 2016 | $2,998 | $172,700 | $74,000 | $98,700 |
| 2015 | $2,870 | $158,100 | $74,000 | $84,100 |
| 2014 | $2,855 | $157,500 | $74,000 | $83,500 |
Map
- 300 Jon Dr
- 269 Jon Dr
- 396 Hovendon Ave
- 299 N Quincy St Unit 1
- 299 N Quincy St Unit 3
- 299 N Quincy St Unit 2
- 31 Emery St
- 25 Linwood St
- 210 Regency Ln Unit 210
- 521 Hampton Way
- 717 Hampton Way
- 156 Hovendon Ave
- 42 Pratt St
- 719 S Franklin St Unit A Block 3
- 50 Baltic Ave
- 52 Quincy St
- 239 Bellevue Ave
- 12 Dodge Rd
- 33 Quincy St
- 14 Leonard Ln
Ask me questions while you tour the home.