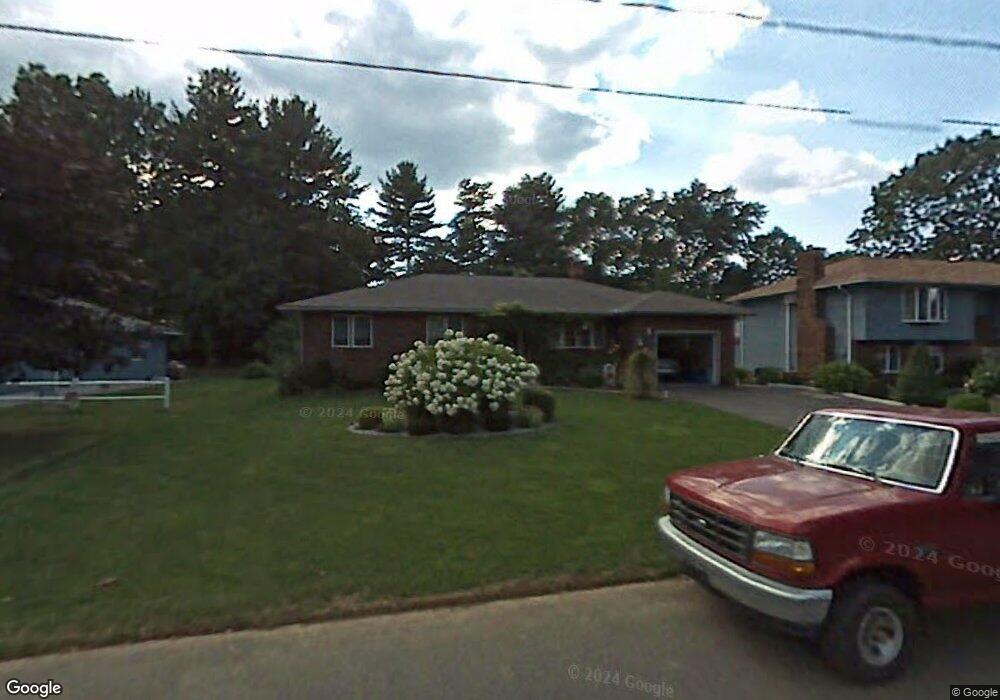
52 Green St Ludlow, MA 01056
Estimated Value: $404,525 - $480,000
3
Beds
2
Baths
1,530
Sq Ft
$287/Sq Ft
Est. Value
About This Home
This home is located at 52 Green St, Ludlow, MA 01056 and is currently estimated at $438,631, approximately $286 per square foot. 52 Green St is a home located in Hampden County with nearby schools including East Street Elementary School, Chapin Street Elementary School, and Paul R. Baird Middle School.
Ownership History
Date
Name
Owned For
Owner Type
Purchase Details
Closed on
Jun 22, 2015
Sold by
Goncalves Jose and Goncalves Antonia
Bought by
Goncalves Antonia and Goncalves Jose
Current Estimated Value
Purchase Details
Closed on
Oct 31, 2013
Sold by
Goncalves Jaime
Bought by
Goncalves Jose and Goncalves Antonia
Purchase Details
Closed on
May 4, 2011
Sold by
Goncalves Jose and Goncalves Antonia
Bought by
Goncalves Jaime
Purchase Details
Closed on
Jan 21, 1985
Bought by
Goncalves Jose and Goncalves Antonia
Create a Home Valuation Report for This Property
The Home Valuation Report is an in-depth analysis detailing your home's value as well as a comparison with similar homes in the area
Home Values in the Area
Average Home Value in this Area
Purchase History
| Date | Buyer | Sale Price | Title Company |
|---|---|---|---|
| Goncalves Antonia | -- | -- | |
| Goncalves Antonia | -- | -- | |
| Goncalves Jose | -- | -- | |
| Goncalves Jose | -- | -- | |
| Goncalves Jaime | -- | -- | |
| Goncalves Jaime | -- | -- | |
| Goncalves Jose | $16,500 | -- |
Source: Public Records
Tax History
| Year | Tax Paid | Tax Assessment Tax Assessment Total Assessment is a certain percentage of the fair market value that is determined by local assessors to be the total taxable value of land and additions on the property. | Land | Improvement |
|---|---|---|---|---|
| 2025 | $6,806 | $392,300 | $82,500 | $309,800 |
| 2024 | $6,462 | $357,200 | $82,400 | $274,800 |
| 2023 | $6,140 | $314,700 | $72,300 | $242,400 |
| 2022 | $5,825 | $291,400 | $72,300 | $219,100 |
| 2021 | $5,786 | $274,500 | $72,300 | $202,200 |
| 2020 | $5,590 | $271,100 | $71,200 | $199,900 |
| 2019 | $5,215 | $263,100 | $70,500 | $192,600 |
| 2018 | $4,865 | $255,900 | $70,500 | $185,400 |
| 2017 | $4,731 | $255,300 | $69,100 | $186,200 |
| 2016 | $4,469 | $246,500 | $67,700 | $178,800 |
| 2015 | $4,188 | $242,200 | $67,000 | $175,200 |
Source: Public Records
Map
Nearby Homes
- 21 Marias Way
- 39 Salli Cir
- 229 Miller St Unit F-6
- 229 Miller St Unit D-6
- 229 Miller St Unit C-1
- 308 Miller St Unit 79
- 101 Ray St
- 140 Kirkland Ave
- 142 Marion Cir
- Lot 28 Tower Rd
- 70 Sroka Ln
- 31 Greenwich St
- 37 Franklin St
- 38 Prospect St
- 22 Essex St
- 517 Ideal Ln Unit 702
- 235 James St
- 80 Elizabeth Dr
- 27 Lodge Ln Unit 27
- 46 Washington Rd
Your Personal Tour Guide
Ask me questions while you tour the home.