52 High St Dixfield, ME 04224
Estimated Value: $163,375 - $204,000
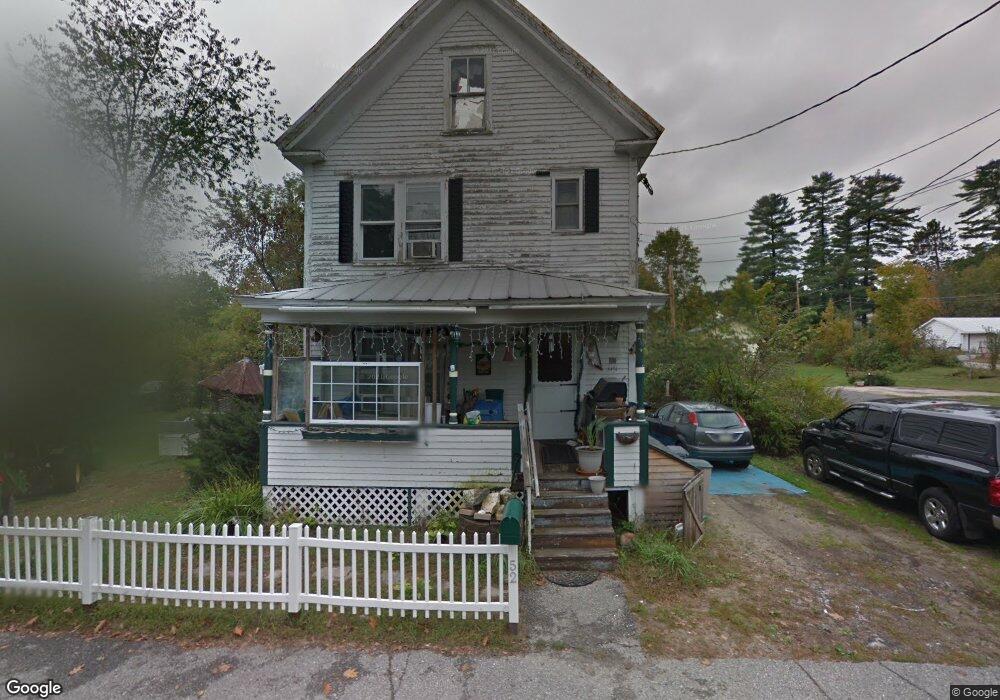
About This Home
This home is located at 52 High St, Dixfield, ME 04224 and is currently estimated at $186,344, approximately $176 per square foot. 52 High St is a home located in Oxford County with nearby schools including Webb River seventh-day Adventist School and Hezion Academy.
Ownership History
We collect this data history from publicly available records. To have your information removed, we recommend requesting removal directly through your county’s website.
Purchase Details
Home Financials for this Owner
Home Financials are based on the most recent Mortgage that was taken out on this home.Purchase History
We collect this data history from publicly available records. To have your information removed, we recommend requesting removal directly through your county’s website.
| Date | Buyer | Sale Price | Title Company |
|---|---|---|---|
| -- | -- |
Mortgage History
We collect this data history from publicly available records. To have your information removed, we recommend requesting removal directly through your county’s website.
| Date | Status | Borrower | Loan Amount |
|---|---|---|---|
| Closed | $21,970 | ||
| Closed | $75,000 | ||
| Closed | $85,200 |
Tax History
We collect this data history from publicly available records. To have your information removed, we recommend requesting removal directly through your county’s website.
| Year | Tax Paid | Tax Assessment Tax Assessment Total Assessment is a certain percentage of the fair market value that is determined by local assessors to be the total taxable value of land and additions on the property. | Land | Improvement |
|---|---|---|---|---|
| 2025 | $1,855 | $76,200 | $17,600 | $58,600 |
| 2024 | $1,703 | $76,200 | $17,600 | $58,600 |
| 2023 | $1,638 | $76,200 | $17,600 | $58,600 |
| 2022 | $1,638 | $76,200 | $17,600 | $58,600 |
| 2021 | $1,829 | $76,200 | $17,600 | $58,600 |
| 2020 | $1,829 | $76,200 | $17,600 | $58,600 |
| 2019 | $2,038 | $75,600 | $17,600 | $58,000 |
| 2018 | $2,016 | $75,800 | $17,600 | $58,200 |
| 2017 | $1,985 | $89,000 | $23,300 | $65,700 |
| 2016 | $483 | $89,000 | $23,300 | $65,700 |
| 2015 | $1,816 | $89,000 | $23,300 | $65,700 |
| 2014 | $1,717 | $88,947 | $23,280 | $65,667 |
| 2013 | $1,730 | $88,947 | $23,280 | $65,667 |
Map
- 40 Pine St
- 22 Lyons Ln
- 19 Main St
- 8 Coburn Ave
- 88 Coburn Ave
- 52 Coburn Ave
- Lot 29 Auburn Rd
- 79 Auburn Rd
- 767 River Rd
- 54 Blayne St
- 260 Weld St
- 77 Red Ledge Rd
- Map 15 Lot 36a
- Lot 8 Coburn Rd
- 198 Ridge Rd
- 0 Old Country Trail Unit 1669326
- Map 135/23 Burgess Hill Rd
- Lot 9 Wyman Hill Rd Unit Lot 9
- 80 Gammon Rd
- 181 Wyman Hill Rd
Ask me questions while you tour the home.