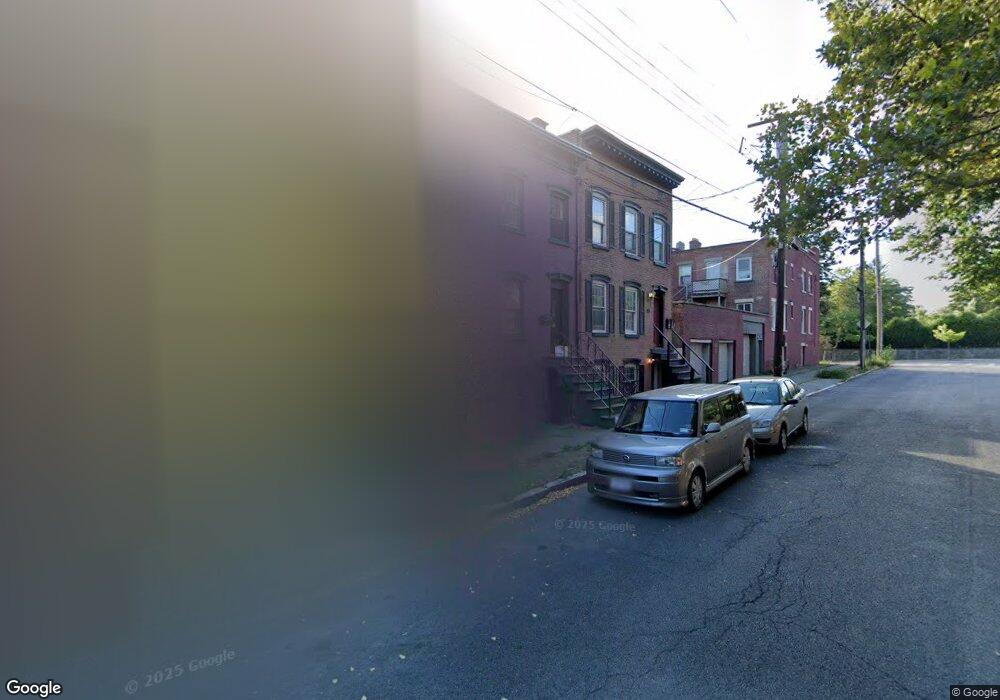
52 Myrtle Ave Albany, NY 12202
Mansion Area NeighborhoodEstimated Value: $267,000 - $406,454
6
Beds
3
Baths
3,300
Sq Ft
$99/Sq Ft
Est. Value
About This Home
This home is located at 52 Myrtle Ave, Albany, NY 12202 and is currently estimated at $326,364, approximately $98 per square foot. 52 Myrtle Ave is a home located in Albany County with nearby schools including Giffen Memorial Elementary School, Stephen And Harriet Myers Middle School, and Albany High School.
Ownership History
Date
Name
Owned For
Owner Type
Purchase Details
Closed on
Feb 15, 2010
Sold by
Taffe Brian P
Bought by
Ellis Christopher G and Bellinger Ellis Andrea A
Current Estimated Value
Home Financials for this Owner
Home Financials are based on the most recent Mortgage that was taken out on this home.
Original Mortgage
$235,144
Outstanding Balance
$153,002
Interest Rate
5.17%
Estimated Equity
$173,362
Purchase Details
Closed on
Jun 5, 2003
Sold by
Cuerdon Wm J
Bought by
Teffe Brian P
Create a Home Valuation Report for This Property
The Home Valuation Report is an in-depth analysis detailing your home's value as well as a comparison with similar homes in the area
Home Values in the Area
Average Home Value in this Area
Purchase History
We collect this data history from publicly available records. To have your information removed, we recommend requesting removal directly through your county’s website.
| Date | Buyer | Sale Price | Title Company |
|---|---|---|---|
| Ellis Christopher G | $240,000 | None Available | |
| Teffe Brian P | $124,000 | John T Biscone |
Source: Public Records
Mortgage History
We collect this data history from publicly available records. To have your information removed, we recommend requesting removal directly through your county’s website.
| Date | Status | Borrower | Loan Amount |
|---|---|---|---|
| Open | Ellis Christopher G | $235,144 |
Source: Public Records
Tax History
| Year | Tax Paid | Tax Assessment Tax Assessment Total Assessment is a certain percentage of the fair market value that is determined by local assessors to be the total taxable value of land and additions on the property. | Land | Improvement |
|---|---|---|---|---|
| 2025 | $6,354 | $218,000 | $43,600 | $174,400 |
| 2024 | $6,354 | $218,000 | $43,600 | $174,400 |
| 2023 | $7,274 | $191,000 | $38,200 | $152,800 |
| 2022 | $7,041 | $191,000 | $38,200 | $152,800 |
| 2021 | $7,000 | $191,000 | $38,200 | $152,800 |
| 2020 | $7,687 | $191,000 | $38,200 | $152,800 |
| 2019 | $7,520 | $191,000 | $38,200 | $152,800 |
| 2018 | $7,641 | $191,000 | $38,200 | $152,800 |
| 2017 | $4,293 | $191,000 | $38,200 | $152,800 |
| 2016 | $7,941 | $191,000 | $38,200 | $152,800 |
| 2015 | $7,505 | $194,300 | $38,900 | $155,400 |
| 2014 | -- | $194,300 | $38,900 | $155,400 |
Source: Public Records
Map
Nearby Homes
- 52 Park Ave
- 74 Philip St
- 5 Myrtle Ave
- 64 Elm St
- 3 Elizabeth St Unit 2
- 27 Osborne St
- 3 Osborne St
- 38 Trinity Place
- 128 Hamilton St
- 61 Grand St
- 26 & 33 Osborne St
- 46 Osborne St
- 96-100 Delaware St
- 54 Delaware St
- 79 Alexander St
- 100 Alexander St
- 144 Hawk St S
- 54 Alexander St
- 329 S Pearl St
- 149-151 3rd Ave
Your Personal Tour Guide
Ask me questions while you tour the home.