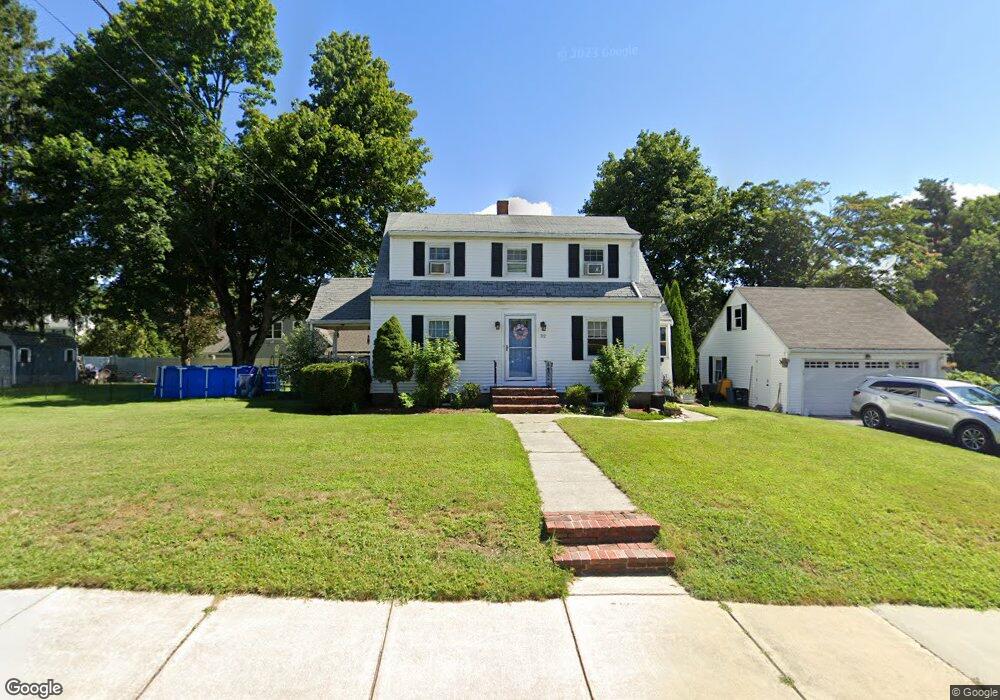
52 Vernon St Woburn, MA 01801
Downtown Woburn NeighborhoodEstimated Value: $666,470 - $713,000
3
Beds
1
Bath
1,440
Sq Ft
$476/Sq Ft
Est. Value
About This Home
This home is located at 52 Vernon St, Woburn, MA 01801 and is currently estimated at $686,118, approximately $476 per square foot. 52 Vernon St is a home located in Middlesex County with nearby schools including Shamrock Elementary School, Daniel L. Joyce Middle School, and Woburn High School.
Ownership History
Date
Name
Owned For
Owner Type
Purchase Details
Closed on
Oct 29, 2010
Sold by
Murray Neil J
Bought by
Raposa Curt M and Raposa Jennifer Kelley
Current Estimated Value
Home Financials for this Owner
Home Financials are based on the most recent Mortgage that was taken out on this home.
Original Mortgage
$239,200
Outstanding Balance
$157,550
Interest Rate
4.39%
Mortgage Type
Purchase Money Mortgage
Estimated Equity
$528,568
Create a Home Valuation Report for This Property
The Home Valuation Report is an in-depth analysis detailing your home's value as well as a comparison with similar homes in the area
Home Values in the Area
Average Home Value in this Area
Purchase History
| Date | Buyer | Sale Price | Title Company |
|---|---|---|---|
| Raposa Curt M | $299,000 | -- | |
| Raposa Curt M | $299,000 | -- |
Source: Public Records
Mortgage History
| Date | Status | Borrower | Loan Amount |
|---|---|---|---|
| Open | Raposa Curt M | $239,200 | |
| Closed | Raposa Curt M | $29,900 | |
| Closed | Raposa Curt M | $239,200 |
Source: Public Records
Tax History
| Year | Tax Paid | Tax Assessment Tax Assessment Total Assessment is a certain percentage of the fair market value that is determined by local assessors to be the total taxable value of land and additions on the property. | Land | Improvement |
|---|---|---|---|---|
| 2025 | $4,929 | $577,200 | $310,700 | $266,500 |
| 2024 | $4,429 | $549,500 | $296,000 | $253,500 |
| 2023 | $4,317 | $496,200 | $269,200 | $227,000 |
| 2022 | $4,179 | $447,400 | $234,400 | $213,000 |
| 2021 | $4,005 | $429,300 | $223,400 | $205,900 |
| 2020 | $3,881 | $416,400 | $223,400 | $193,000 |
| 2019 | $14,877 | $391,500 | $212,900 | $178,600 |
| 2018 | $3,612 | $365,200 | $195,600 | $169,600 |
| 2017 | $3,376 | $339,600 | $186,400 | $153,200 |
| 2016 | $3,307 | $329,100 | $174,400 | $154,700 |
| 2015 | $3,181 | $312,800 | $163,100 | $149,700 |
| 2014 | $3,123 | $299,100 | $163,100 | $136,000 |
Source: Public Records
Map
Nearby Homes
- 164 Green St
- 219 Montvale Ae
- 18 Sherman Place
- 23 Buttaro Rd
- 0 Mount Pleasant St
- 20 Hilltop Terrace
- 31 Montvale Ave Unit 2
- 28 Everett St
- 7 Prospect St
- 15 East St
- 477 Main St
- 74 Beach St Unit 1-1
- 14 Church Ave
- 52 Pleasant St
- 7 Conant Rd Unit 53
- 66 Park St
- 87 Wendell St
- 380 Cross St
- 104 Wendell St
- 87 Winn St Unit 1
Your Personal Tour Guide
Ask me questions while you tour the home.