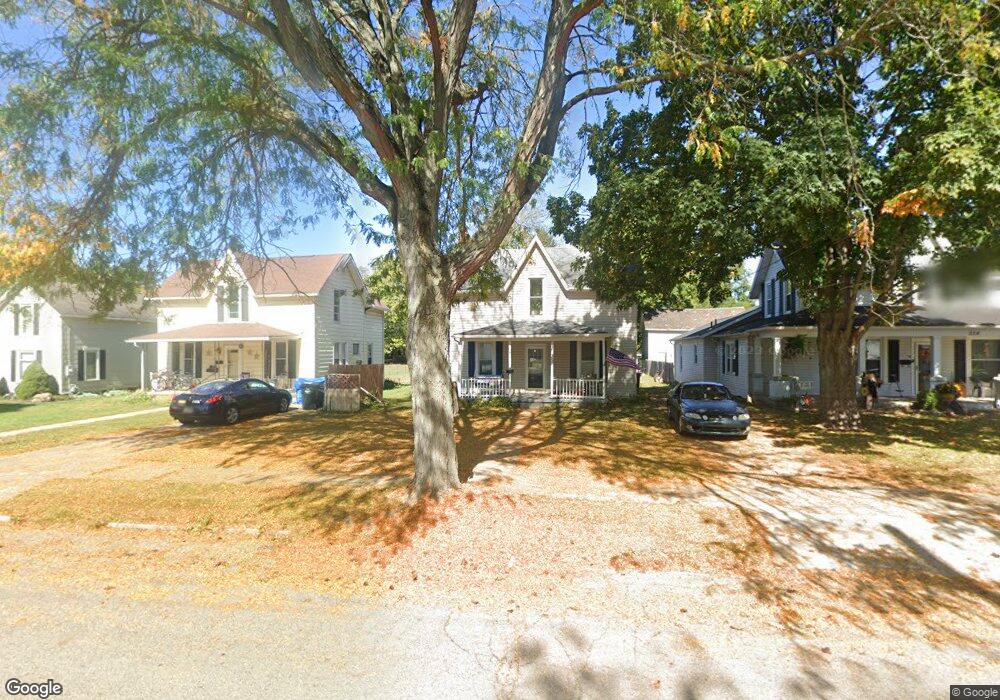
520 Boyce St Urbana, OH 43078
Estimated Value: $157,000 - $238,000
3
Beds
1
Bath
1,132
Sq Ft
$177/Sq Ft
Est. Value
About This Home
This home is located at 520 Boyce St, Urbana, OH 43078 and is currently estimated at $200,608, approximately $177 per square foot. 520 Boyce St is a home located in Champaign County with nearby schools including Urbana Elementary School, Urbana Junior High School, and Urbana High School.
Ownership History
Date
Name
Owned For
Owner Type
Purchase Details
Closed on
Jul 18, 2003
Sold by
Fleming Laurie L
Bought by
Clark Brian
Current Estimated Value
Home Financials for this Owner
Home Financials are based on the most recent Mortgage that was taken out on this home.
Original Mortgage
$73,448
Outstanding Balance
$31,321
Interest Rate
5.3%
Mortgage Type
FHA
Estimated Equity
$169,287
Purchase Details
Closed on
Jan 5, 1998
Sold by
Laird Terry
Bought by
Fleming Kirk G and Fleming Laura L
Home Financials for this Owner
Home Financials are based on the most recent Mortgage that was taken out on this home.
Original Mortgage
$69,000
Interest Rate
7.28%
Mortgage Type
New Conventional
Create a Home Valuation Report for This Property
The Home Valuation Report is an in-depth analysis detailing your home's value as well as a comparison with similar homes in the area
Home Values in the Area
Average Home Value in this Area
Purchase History
We collect this data history from publicly available records. To have your information removed, we recommend requesting removal directly through your county’s website.
| Date | Buyer | Sale Price | Title Company |
|---|---|---|---|
| Clark Brian | $72,000 | -- | |
| Fleming Kirk G | $69,000 | -- |
Source: Public Records
Mortgage History
We collect this data history from publicly available records. To have your information removed, we recommend requesting removal directly through your county’s website.
| Date | Status | Borrower | Loan Amount |
|---|---|---|---|
| Open | Clark Brian | $73,448 | |
| Previous Owner | Fleming Kirk G | $69,000 |
Source: Public Records
Tax History
| Year | Tax Paid | Tax Assessment Tax Assessment Total Assessment is a certain percentage of the fair market value that is determined by local assessors to be the total taxable value of land and additions on the property. | Land | Improvement |
|---|---|---|---|---|
| 2025 | $1,463 | $53,220 | $7,660 | $45,560 |
| 2024 | $1,463 | $36,490 | $5,400 | $31,090 |
| 2023 | $1,098 | $36,490 | $5,400 | $31,090 |
| 2022 | $1,164 | $36,490 | $5,400 | $31,090 |
| 2021 | $924 | $28,270 | $4,320 | $23,950 |
| 2020 | $924 | $28,270 | $4,320 | $23,950 |
| 2019 | $913 | $28,270 | $4,320 | $23,950 |
| 2018 | $900 | $27,150 | $3,720 | $23,430 |
| 2017 | $1,319 | $27,150 | $3,720 | $23,430 |
| 2016 | $1,322 | $27,150 | $3,720 | $23,430 |
| 2015 | $1,307 | $26,060 | $3,720 | $22,340 |
| 2014 | $1,309 | $26,060 | $3,720 | $22,340 |
| 2013 | $1,114 | $26,060 | $3,720 | $22,340 |
Source: Public Records
Map
Nearby Homes
- 437 Boyce St
- 625 Boyce St
- 544 Bloomfield Ave
- 402 E Ward St
- 204 Lafayette Ave
- 123 Washington Ave
- 943 E Lawn Ave Unit 33
- 333 E Court St
- 836 & 842 N Main St
- 242 Laurel Oak St
- 427 N Walnut St
- 596 Scioto St
- 225 N Jefferson Ave
- 655 Louden St
- 213 E Court St
- 609 Julia St Unit 12
- 328 W Light St
- 727 N Russell St
- 711 N Russell St
- 704 N Russell St
Your Personal Tour Guide
Ask me questions while you tour the home.