520 E Main St Danville, IN 46122
Estimated Value: $318,000 - $335,000
About This Home
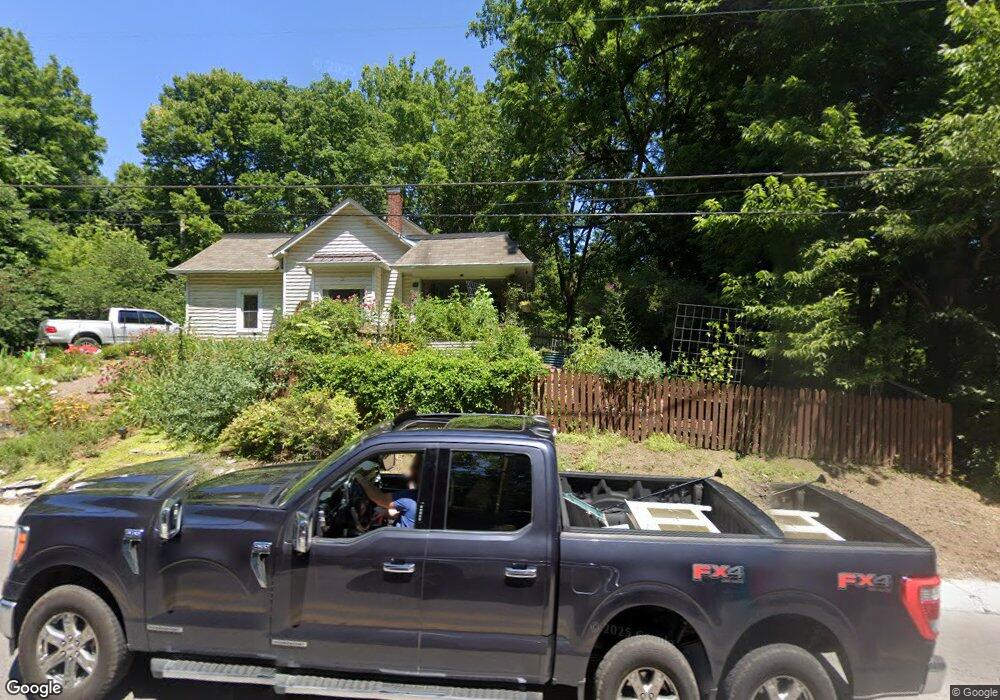
This home is located at 520 E Main St, Danville, IN 46122 and is currently estimated at $327,649, approximately $161 per square foot. 520 E Main St is a home located in Hendricks County with nearby schools including North Elementary School, South Elementary School, and Danville Middle School.
Ownership History
We collect this data history from publicly available records. To have your information removed, we recommend requesting removal directly through your county’s website.
Purchase Details
Home Financials for this Owner
Home Financials are based on the most recent Mortgage that was taken out on this home.Home Values in the Area
Average Home Value in this Area
Purchase History
We collect this data history from publicly available records. To have your information removed, we recommend requesting removal directly through your county’s website.
| Date | Buyer | Sale Price | Title Company |
|---|---|---|---|
| -- | None Listed On Document |
Mortgage History
We collect this data history from publicly available records. To have your information removed, we recommend requesting removal directly through your county’s website.
| Date | Status | Borrower | Loan Amount |
|---|---|---|---|
| Open | $289,750 |
Tax History
We collect this data history from publicly available records. To have your information removed, we recommend requesting removal directly through your county’s website.
| Year | Tax Paid | Tax Assessment Tax Assessment Total Assessment is a certain percentage of the fair market value that is determined by local assessors to be the total taxable value of land and additions on the property. | Land | Improvement |
|---|---|---|---|---|
| 2025 | $2,515 | $278,800 | $51,800 | $227,000 |
| 2024 | $2,712 | $270,700 | $51,800 | $218,900 |
| 2023 | $2,761 | $272,200 | $51,700 | $220,500 |
| 2022 | $2,295 | $230,400 | $47,900 | $182,500 |
| 2021 | $2,021 | $196,500 | $43,500 | $153,000 |
| 2020 | $1,999 | $194,100 | $43,500 | $150,600 |
| 2019 | $1,880 | $182,200 | $36,200 | $146,000 |
| 2018 | $1,831 | $177,200 | $36,200 | $141,000 |
| 2017 | $1,779 | $171,100 | $34,500 | $136,600 |
| 2016 | $1,713 | $165,300 | $34,500 | $130,800 |
| 2014 | $1,463 | $139,600 | $33,800 | $105,800 |
Map
- 148 S Wayne St
- 4718 W Country Rd Unit 150
- 407 N Wayne St
- 208 E Poplar St
- 10 Stratford Way
- 207 E Poplar St
- 202 N Jefferson St
- 181 W Broadway St
- 3969 Canning St
- 23 Northview Dr
- 498 W Main St
- 502 W Main St
- 143 High St
- 647 Peach Tree Ln
- 1548 Tottenham Dr
- 655 Barrett St
- 520 W Lincoln St
- 502 Apple St
- 555 Meadow Dr
- 275 Lucky Hat Ln
- 502 E Main St
- 482 E Main St
- 430 E Main St
- 485 E Main St
- 396 E Main St
- 545 E Main St
- 395 E Main St
- 395 E Main St
- 395 E Main St Unit A
- 395 E Main St Unit B
- 365 E Main St
- 414 E Broadway St
- 343 E Main St
- 343 E Main St
- 326 E Main St
- 329 E Main St
- 329 - E Main St
- 410 E Broadway St
- 450 E Broadway St
- 418 E Broadway St
Ask me questions while you tour the home.