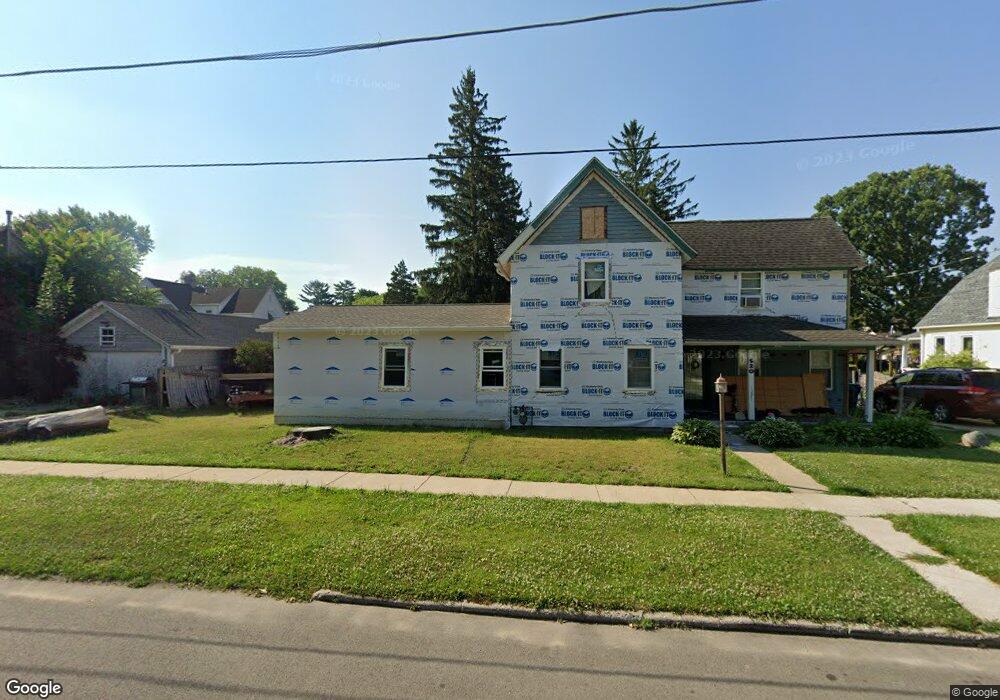
520 E Morgan St Dixon, IL 61021
North Dixon NeighborhoodEstimated Value: $182,000 - $222,000
3
Beds
2
Baths
1,318
Sq Ft
$150/Sq Ft
Est. Value
About This Home
This home is located at 520 E Morgan St, Dixon, IL 61021 and is currently estimated at $197,939, approximately $150 per square foot. 520 E Morgan St is a home located in Lee County with nearby schools including Washington Elementary School, Jefferson Elementary School, and Madison Elementary School.
Ownership History
Date
Name
Owned For
Owner Type
Purchase Details
Closed on
Jul 30, 2007
Sold by
Silsby Erin
Bought by
Peterson Brant N and Shepard Maria
Current Estimated Value
Home Financials for this Owner
Home Financials are based on the most recent Mortgage that was taken out on this home.
Original Mortgage
$88,000
Outstanding Balance
$54,826
Interest Rate
6.71%
Mortgage Type
New Conventional
Estimated Equity
$143,113
Purchase Details
Closed on
Dec 30, 2005
Sold by
Reising Jeremy and Mulligan Reising Krista
Bought by
Silsby Erin
Create a Home Valuation Report for This Property
The Home Valuation Report is an in-depth analysis detailing your home's value as well as a comparison with similar homes in the area
Home Values in the Area
Average Home Value in this Area
Purchase History
We collect this data history from publicly available records. To have your information removed, we recommend requesting removal directly through your county’s website.
| Date | Buyer | Sale Price | Title Company |
|---|---|---|---|
| Peterson Brant N | $110,000 | None Available | |
| Silsby Erin | $99,500 | None Available |
Source: Public Records
Mortgage History
We collect this data history from publicly available records. To have your information removed, we recommend requesting removal directly through your county’s website.
| Date | Status | Borrower | Loan Amount |
|---|---|---|---|
| Open | Peterson Brant N | $88,000 |
Source: Public Records
Tax History
| Year | Tax Paid | Tax Assessment Tax Assessment Total Assessment is a certain percentage of the fair market value that is determined by local assessors to be the total taxable value of land and additions on the property. | Land | Improvement |
|---|---|---|---|---|
| 2024 | $4,439 | $54,459 | $16,640 | $37,819 |
| 2023 | $4,085 | $49,962 | $15,266 | $34,696 |
| 2022 | $3,729 | $45,011 | $13,753 | $31,258 |
| 2021 | $3,444 | $41,677 | $12,734 | $28,943 |
| 2020 | $3,288 | $39,693 | $12,128 | $27,565 |
| 2019 | $3,194 | $38,537 | $11,775 | $26,762 |
| 2018 | $3,061 | $37,781 | $11,544 | $26,237 |
| 2017 | $2,917 | $36,328 | $11,100 | $25,228 |
| 2016 | $2,830 | $35,270 | $10,777 | $24,493 |
| 2015 | $2,713 | $35,270 | $10,777 | $24,493 |
| 2014 | $2,667 | $35,270 | $10,777 | $24,493 |
| 2013 | $2,675 | $36,000 | $11,000 | $25,000 |
Source: Public Records
Map
Nearby Homes
- 529 E Mckenney St
- 807 E Fellows St
- 412 E Bradshaw St
- 109 E Chamberlin St
- 318 N Galena Ave
- 422 N Hennepin Ave
- 507 N Hennepin Ave
- 217 W Morgan St
- 940 N Dement Ave
- 218 Lincoln Way
- 1213 Douglas Terrace
- 304 W Chamberlin St
- 1107 University St
- 1106 Steinman St
- 344 W Everett St
- 1435 Lanewood Dr
- 291 Illinois 2 Unit 11
- 291 Illinois 2 Unit 49
- 1212 Ogletree Place
- 609 Moss Place
- 516 E Morgan St
- 521 N Jefferson Ave
- 517 N Jefferson Ave
- 510 E Morgan St
- 509 N Jefferson Ave
- 521 E Chamberlin St
- 515 E Chamberlin St
- 509 E Chamberlin St
- 527 E Chamberlin St
- 522 N Dement Ave
- 516 N Dement Ave
- 603 N Jefferson Ave
- 523 E Morgan St
- 531 E Chamberlin St
- 607 N Jefferson Ave
- 517 E Morgan St
- 510 N Dement Ave
- 507 E Morgan St
- 513 E Morgan St
- 606 E Morgan St
Your Personal Tour Guide
Ask me questions while you tour the home.