520 Main St Covington, KY 41011
Downtown Covington NeighborhoodEstimated Value: $531,883
About This Home
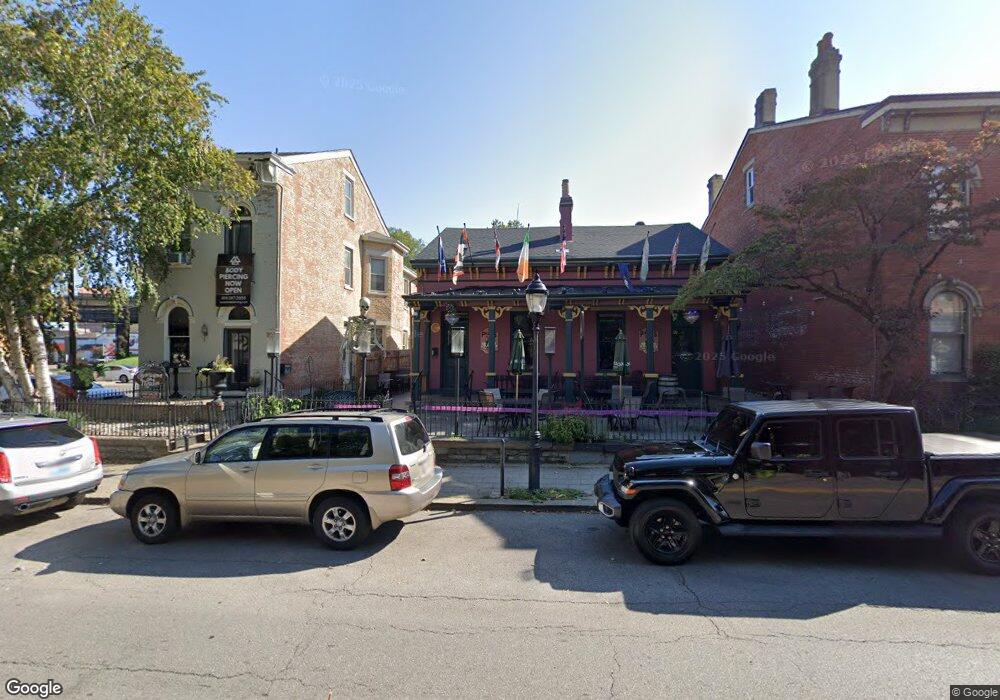
This home is located at 520 Main St, Covington, KY 41011 and is currently estimated at $531,883, approximately $428 per square foot. 520 Main St is a home located in Kenton County with nearby schools including Holmes High School, Prince of Peace School, and Saint Augustine Catholic School.
Ownership History
We collect this data history from publicly available records. To have your information removed, we recommend requesting removal directly through your county’s website.
Purchase Details
Purchase Details
Purchase Details
Purchase Details
Home Values in the Area
Average Home Value in this Area
Purchase History
We collect this data history from publicly available records. To have your information removed, we recommend requesting removal directly through your county’s website.
| Date | Buyer | Sale Price | Title Company |
|---|---|---|---|
| -- | None Listed On Document | ||
| $145,000 | None Available | ||
| $58,000 | -- | ||
| $55,800 | -- |
Tax History
We collect this data history from publicly available records. To have your information removed, we recommend requesting removal directly through your county’s website.
| Year | Tax Paid | Tax Assessment Tax Assessment Total Assessment is a certain percentage of the fair market value that is determined by local assessors to be the total taxable value of land and additions on the property. | Land | Improvement |
|---|---|---|---|---|
| 2025 | $8,314 | $627,500 | $75,000 | $552,500 |
| 2024 | $8,252 | $627,500 | $75,000 | $552,500 |
| 2023 | $2,364 | $177,500 | $37,500 | $140,000 |
| 2022 | $2,563 | $177,500 | $37,500 | $140,000 |
| 2021 | $2,243 | $145,000 | $10,000 | $135,000 |
| 2020 | $2,231 | $145,000 | $10,000 | $135,000 |
| 2019 | $2,257 | $145,000 | $10,000 | $135,000 |
| 2018 | $1,212 | $74,000 | $10,000 | $64,000 |
| 2017 | $1,229 | $74,000 | $25,000 | $49,000 |
| 2015 | $1,596 | $74,000 | $25,000 | $49,000 |
| 2014 | $1,581 | $74,000 | $25,000 | $49,000 |
Map
- 501 Johnson St
- 402 Johnson St
- 229 W 4th St
- 218 W 5th St
- 244 W 4th St
- 518 W 7th St
- 232 W 4th St
- 278 W 8th St
- 326 W 8th St
- 208 W 4th St Unit 302
- 130 W 4th St
- 128 W 4th St
- 126 W 4th St
- 124 W 4th St
- 834 Main St
- 325 W 9th St
- 652 Western Ave
- 100 W Rivercenter Blvd Unit PH3B
- 806 Crescent Ave
- 1025 Banklick St
Ask me questions while you tour the home.