520 Power Rd Pawtucket, RI 02860
Fairlawn NeighborhoodEstimated Value: $504,375 - $612,000
About This Home
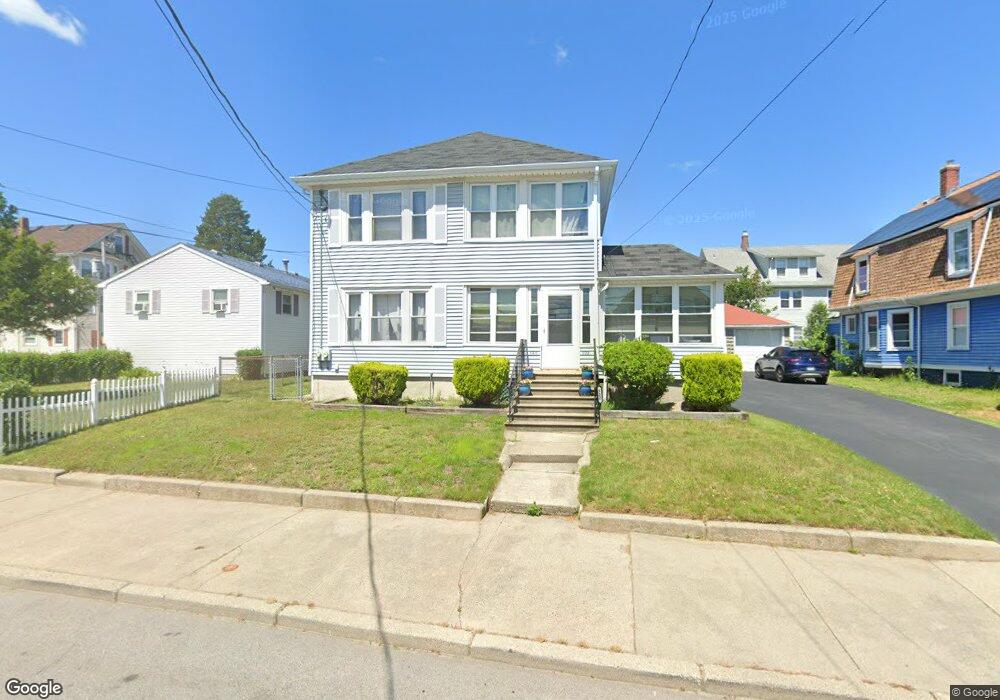
This home is located at 520 Power Rd, Pawtucket, RI 02860 and is currently estimated at $538,094, approximately $243 per square foot. 520 Power Rd is a home located in Providence County with nearby schools including Blackstone Valley Prep Upper Elementary School, Blackstone Valley Prep Junior High School, and Bishop Keough Regional High School.
Ownership History
We collect this data history from publicly available records. To have your information removed, we recommend requesting removal directly through your county’s website.
Purchase Details
Home Financials for this Owner
Home Financials are based on the most recent Mortgage that was taken out on this home.Home Values in the Area
Average Home Value in this Area
Purchase History
We collect this data history from publicly available records. To have your information removed, we recommend requesting removal directly through your county’s website.
| Date | Buyer | Sale Price | Title Company |
|---|---|---|---|
| $148,872 | None Available |
Mortgage History
We collect this data history from publicly available records. To have your information removed, we recommend requesting removal directly through your county’s website.
| Date | Status | Borrower | Loan Amount |
|---|---|---|---|
| Open | $148,872 |
Tax History
We collect this data history from publicly available records. To have your information removed, we recommend requesting removal directly through your county’s website.
| Year | Tax Paid | Tax Assessment Tax Assessment Total Assessment is a certain percentage of the fair market value that is determined by local assessors to be the total taxable value of land and additions on the property. | Land | Improvement |
|---|---|---|---|---|
| 2025 | $5,674 | $431,500 | $136,300 | $295,200 |
| 2024 | $5,325 | $431,500 | $136,300 | $295,200 |
| 2023 | $4,962 | $292,900 | $82,200 | $210,700 |
| 2022 | $4,856 | $292,900 | $82,200 | $210,700 |
| 2021 | $4,856 | $292,900 | $82,200 | $210,700 |
| 2020 | $4,253 | $203,600 | $57,700 | $145,900 |
| 2019 | $4,253 | $203,600 | $57,700 | $145,900 |
| 2018 | $4,098 | $203,600 | $57,700 | $145,900 |
| 2017 | $4,056 | $178,500 | $63,800 | $114,700 |
| 2016 | $3,907 | $178,500 | $63,800 | $114,700 |
| 2015 | $3,907 | $178,500 | $63,800 | $114,700 |
| 2014 | $3,899 | $169,100 | $63,800 | $105,300 |
Map
- 135 Owen Ave
- 153 Chandler Ave
- 214 Morris Ave
- 112 Owen Ave
- 123 Francis Ave
- 224 Francis Ave
- 164 Morris Ave
- 463 Power Rd
- 82 Owen Ave
- 94 Francis Ave
- 19 Hopkins St
- 121 Samuel Ave
- 16 Rufus St
- 111 Anderton Ave
- 458 Smithfield Ave
- 460 Smithfield Ave
- 101 Manchester Farm Rd
- 49 Francis Ave
- 12 Thomas Ave
- 128 Atwood Ave
Ask me questions while you tour the home.