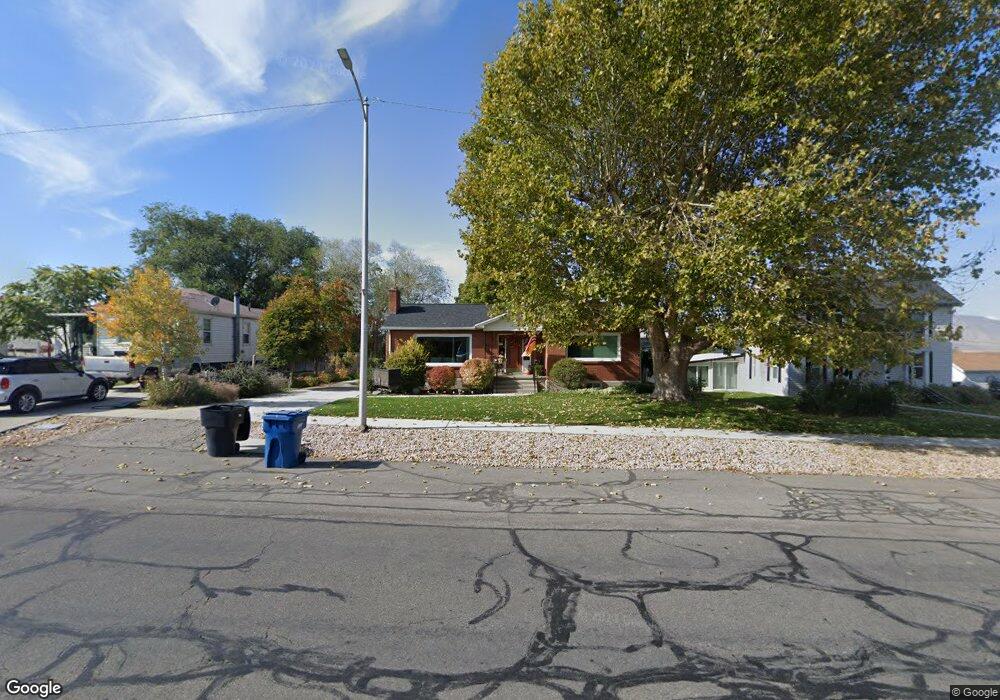
520 S Main St Payson, UT 84651
Estimated Value: $545,000 - $599,000
3
Beds
3
Baths
2,040
Sq Ft
$277/Sq Ft
Est. Value
About This Home
This home is located at 520 S Main St, Payson, UT 84651 and is currently estimated at $565,302, approximately $277 per square foot. 520 S Main St is a home located in Utah County with nearby schools including Park View Elementary, Payson Junior High School, and Payson High School.
Ownership History
Date
Name
Owned For
Owner Type
Purchase Details
Closed on
Jul 18, 2017
Sold by
Cook Jan B and The Beckstrom Family Trust
Bought by
Cook George and Cook Jan
Current Estimated Value
Purchase Details
Closed on
Jan 17, 2013
Sold by
Beckstrom Frank and Beckstrom Frank A
Bought by
Beckstrom Fank A and Beckstrom Family Trust
Purchase Details
Closed on
Mar 9, 2005
Sold by
Ingram Phyllis Merle
Bought by
Paskett John T
Home Financials for this Owner
Home Financials are based on the most recent Mortgage that was taken out on this home.
Original Mortgage
$120,728
Interest Rate
5.65%
Mortgage Type
Seller Take Back
Create a Home Valuation Report for This Property
The Home Valuation Report is an in-depth analysis detailing your home's value as well as a comparison with similar homes in the area
Home Values in the Area
Average Home Value in this Area
Purchase History
We collect this data history from publicly available records. To have your information removed, we recommend requesting removal directly through your county’s website.
| Date | Buyer | Sale Price | Title Company |
|---|---|---|---|
| Cook George | -- | North American Title | |
| Beckstrom Fank A | -- | None Available | |
| Paskett John T | -- | Eagle Pointe Title Insuranc |
Source: Public Records
Mortgage History
We collect this data history from publicly available records. To have your information removed, we recommend requesting removal directly through your county’s website.
| Date | Status | Borrower | Loan Amount |
|---|---|---|---|
| Previous Owner | Paskett John T | $120,728 |
Source: Public Records
Tax History
| Year | Tax Paid | Tax Assessment Tax Assessment Total Assessment is a certain percentage of the fair market value that is determined by local assessors to be the total taxable value of land and additions on the property. | Land | Improvement |
|---|---|---|---|---|
| 2025 | $2,914 | $316,250 | -- | -- |
| 2024 | $2,887 | $296,560 | $0 | $0 |
| 2023 | $77 | $294,580 | $0 | $0 |
| 2022 | $77 | $271,700 | $0 | $0 |
| 2021 | $2,239 | $360,400 | $104,400 | $256,000 |
| 2020 | $1,697 | $336,900 | $94,900 | $242,000 |
| 2019 | $1,697 | $274,000 | $81,900 | $192,100 |
| 2018 | $1,678 | $261,100 | $69,000 | $192,100 |
| 2017 | $1,534 | $128,370 | $0 | $0 |
| 2016 | $1,360 | $113,080 | $0 | $0 |
| 2015 | $1,197 | $98,890 | $0 | $0 |
| 2014 | $1,142 | $94,985 | $0 | $0 |
Source: Public Records
Map
Nearby Homes
Your Personal Tour Guide
Ask me questions while you tour the home.