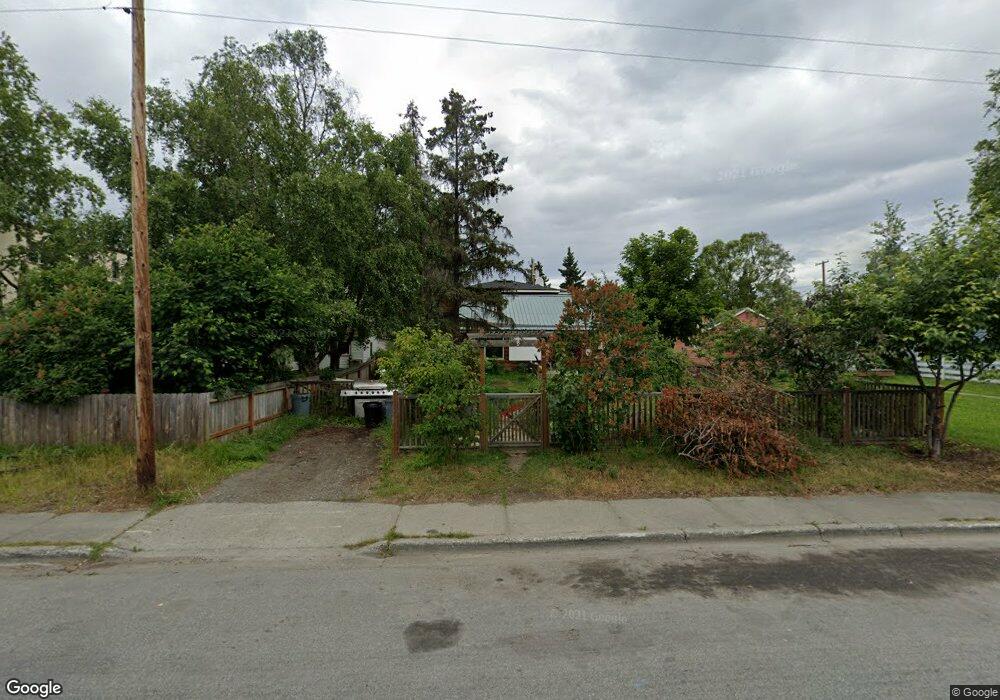
521 E 10th Ave Anchorage, AK 99501
Fairview NeighborhoodEstimated Value: $455,000 - $526,322
5
Beds
2
Baths
2,166
Sq Ft
$227/Sq Ft
Est. Value
About This Home
This home is located at 521 E 10th Ave, Anchorage, AK 99501 and is currently estimated at $490,661, approximately $226 per square foot. 521 E 10th Ave is a home located in Anchorage Municipality with nearby schools including Central Middle School of Science, West High School, and Frontier Charter School.
Ownership History
Date
Name
Owned For
Owner Type
Purchase Details
Closed on
Apr 24, 2015
Sold by
Larson Troy C
Bought by
Mall Shanna M
Current Estimated Value
Home Financials for this Owner
Home Financials are based on the most recent Mortgage that was taken out on this home.
Original Mortgage
$325,050
Outstanding Balance
$249,414
Interest Rate
3.73%
Mortgage Type
New Conventional
Estimated Equity
$241,247
Purchase Details
Closed on
Apr 13, 2004
Sold by
Mall Shanna M and Larson Troy C
Bought by
Larson Troy C and Mall Shanna M
Home Financials for this Owner
Home Financials are based on the most recent Mortgage that was taken out on this home.
Original Mortgage
$135,775
Interest Rate
5.57%
Mortgage Type
New Conventional
Purchase Details
Closed on
Sep 25, 2002
Sold by
Cutler Beverly W
Bought by
Mall Shanna M and Larson Troy C
Home Financials for this Owner
Home Financials are based on the most recent Mortgage that was taken out on this home.
Original Mortgage
$135,375
Interest Rate
6.16%
Mortgage Type
Purchase Money Mortgage
Create a Home Valuation Report for This Property
The Home Valuation Report is an in-depth analysis detailing your home's value as well as a comparison with similar homes in the area
Home Values in the Area
Average Home Value in this Area
Purchase History
| Date | Buyer | Sale Price | Title Company |
|---|---|---|---|
| Mall Shanna M | -- | Auta | |
| Larson Troy C | -- | -- | |
| Mall Shanna M | -- | -- |
Source: Public Records
Mortgage History
| Date | Status | Borrower | Loan Amount |
|---|---|---|---|
| Open | Mall Shanna M | $325,050 | |
| Previous Owner | Larson Troy C | $135,775 | |
| Previous Owner | Mall Shanna M | $135,375 |
Source: Public Records
Tax History
| Year | Tax Paid | Tax Assessment Tax Assessment Total Assessment is a certain percentage of the fair market value that is determined by local assessors to be the total taxable value of land and additions on the property. | Land | Improvement |
|---|---|---|---|---|
| 2025 | $8,623 | $572,800 | $104,700 | $468,100 |
| 2024 | $8,623 | $534,100 | $104,700 | $429,400 |
| 2023 | $8,655 | $508,200 | $104,700 | $403,500 |
| 2022 | $7,841 | $465,600 | $104,700 | $360,900 |
| 2021 | $7,538 | $418,300 | $104,700 | $313,600 |
| 2020 | $7,023 | $413,100 | $104,700 | $308,400 |
| 2019 | $6,837 | $417,900 | $104,700 | $313,200 |
| 2018 | $6,817 | $415,700 | $100,400 | $315,300 |
| 2017 | $6,754 | $431,300 | $100,400 | $330,900 |
| 2016 | $5,121 | $430,300 | $96,800 | $333,500 |
| 2015 | $5,121 | $414,400 | $96,800 | $317,600 |
| 2014 | $5,121 | $390,700 | $96,700 | $294,000 |
Source: Public Records
Map
Nearby Homes
- 414 E 9th Ave
- 615 E 11th Ave
- 440 E 11th Ave Unit 1
- 436 E 11th Ave Unit 23
- 1030 Denali St
- 423 E 12th Ave
- 915 Hyder St
- 837 E 11th Ave
- 000 E 8th Ave
- 628 Gambell St
- 222 E 7th Ave Unit 301
- 525 E 14th Ave
- 329 E 14th Ave Unit 107
- 329 E 14th Ave Unit 11
- 201 E 13th Ave
- 1310 Ingra St
- 140 W 10th Ave Unit 4
- 140 W 10th Ave
- L12 B29D 15th & Denali St
- 1327 Ingra St
- 531 E 10th Ave
- 513 E 10th Ave
- 537 E 10th Ave
- 925 Eagle St
- 940 Fairbanks St
- 518 E 9th Ave
- 530 E 9th Ave
- 504 E 10th Ave
- 532 E 9th Ave
- 522 E 10th Ave
- 940 Eagle St
- 516 E 10th Ave Unit 3
- 516 E 10th Ave Unit 4
- 516 E 10th Ave Unit 1
- 516 E 10th Ave
- 516 E 10th Ave Unit 2
- 544 E 9th Ave
- 1021 Eagle St
- 536 E 10th Ave
- 544 E 10th Ave
Your Personal Tour Guide
Ask me questions while you tour the home.