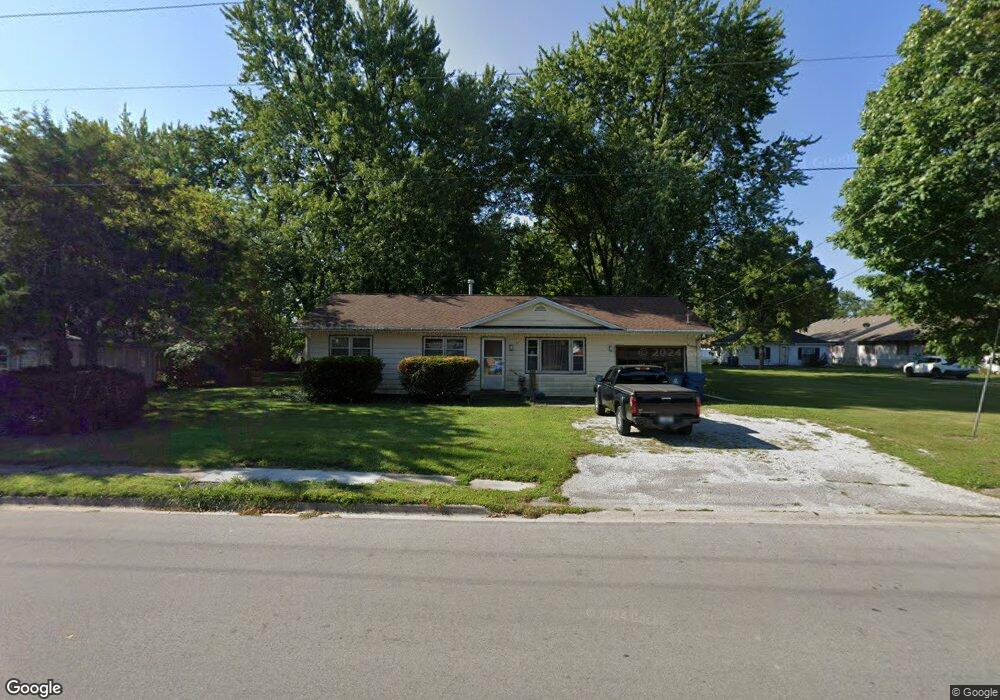
521 E Elm St Watseka, IL 60970
Estimated Value: $68,709 - $112,000
Studio
--
Bath
--
Sq Ft
18,731
Sq Ft Lot
About This Home
This home is located at 521 E Elm St, Watseka, IL 60970 and is currently estimated at $93,177. 521 E Elm St is a home located in Iroquois County with nearby schools including Wanda Kendall Elementary School, Watseka Community High School, and Watseka Junior High School.
Ownership History
Date
Name
Owned For
Owner Type
Purchase Details
Closed on
Jun 29, 2017
Sold by
Rosenboom Ruth A and Rosenboom Lyn A
Bought by
Shipley Charles
Current Estimated Value
Home Financials for this Owner
Home Financials are based on the most recent Mortgage that was taken out on this home.
Original Mortgage
$20,800
Outstanding Balance
$17,888
Interest Rate
5.25%
Mortgage Type
Adjustable Rate Mortgage/ARM
Estimated Equity
$75,289
Purchase Details
Closed on
Sep 10, 2013
Sold by
Florine Florine
Bought by
Rosenboom Roland
Create a Home Valuation Report for This Property
The Home Valuation Report is an in-depth analysis detailing your home's value as well as a comparison with similar homes in the area
Home Values in the Area
Average Home Value in this Area
Purchase History
| Date | Buyer | Sale Price | Title Company |
|---|---|---|---|
| Shipley Charles | $26,000 | None Available | |
| Rosenboom Roland | $20,000 | -- | |
| Rosenboom Roland | $20,000 | -- |
Source: Public Records
Mortgage History
| Date | Status | Borrower | Loan Amount |
|---|---|---|---|
| Open | Shipley Charles | $20,800 |
Source: Public Records
Tax History
| Year | Tax Paid | Tax Assessment Tax Assessment Total Assessment is a certain percentage of the fair market value that is determined by local assessors to be the total taxable value of land and additions on the property. | Land | Improvement |
|---|---|---|---|---|
| 2024 | $2,502 | $24,620 | $3,340 | $21,280 |
| 2023 | $2,502 | $22,580 | $3,060 | $19,520 |
| 2022 | $2,386 | $18,940 | $2,570 | $16,370 |
| 2021 | $2,053 | $18,380 | $2,490 | $15,890 |
| 2020 | $2,211 | $19,650 | $2,660 | $16,990 |
| 2019 | $2,129 | $19,000 | $2,570 | $16,430 |
| 2018 | $2,080 | $18,500 | $2,500 | $16,000 |
| 2017 | $2,113 | $18,180 | $2,460 | $15,720 |
| 2016 | $2,128 | $18,180 | $2,460 | $15,720 |
| 2015 | $1,950 | $17,950 | $2,430 | $15,520 |
| 2014 | $1,950 | $17,630 | $2,390 | $15,240 |
| 2013 | $497 | $18,410 | $2,500 | $15,910 |
Source: Public Records
Map
Nearby Homes
- 525 E Hickory St
- 708 E Sycamore St
- 422 E Ash St
- 520 N 6th St
- 322 N 6th St
- 707 E Ash St
- 551 N Clarence Ave
- 427 E Oak St
- 745 E Oak St
- 335 E Oak St
- 466 E Cherry St
- 602 E Cherry St
- 109 E Sheridan St
- 312 N 4th St
- 538 E Mulberry St
- 320 E Locust St
- 850 E Locust St
- 906 E Locust St
- 429 N 3rd St
- 460 S Ralph St
Your Personal Tour Guide
Ask me questions while you tour the home.