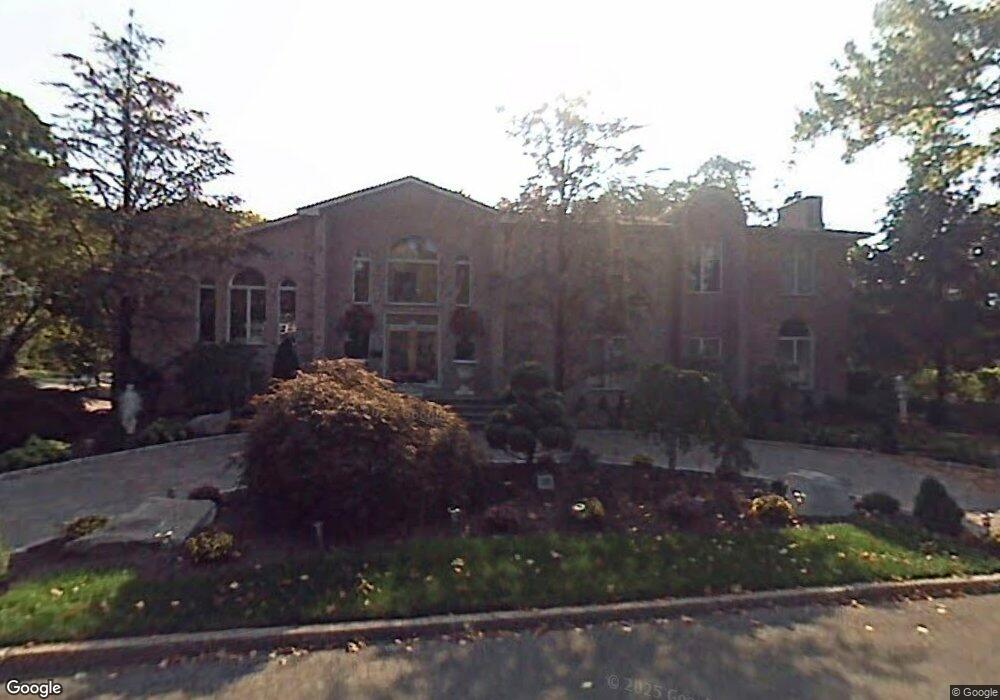
521 Summit St Englewood Cliffs, NJ 07632
Estimated Value: $2,029,326 - $2,861,000
About This Home
This home is located at 521 Summit St, Englewood Cliffs, NJ 07632 and is currently estimated at $2,345,082, approximately $479 per square foot. 521 Summit St is a home located in Bergen County with nearby schools including North Cliff Elementary School, Upper School Elementary School, and Englewood on the Palisades Charter School.
Ownership History
We collect this data history from publicly available records. To have your information removed, we recommend requesting removal directly through your county’s website.
Purchase Details
Home Financials for this Owner
Home Financials are based on the most recent Mortgage that was taken out on this home.Home Values in the Area
Average Home Value in this Area
Purchase History
We collect this data history from publicly available records. To have your information removed, we recommend requesting removal directly through your county’s website.
| Date | Buyer | Sale Price | Title Company |
|---|---|---|---|
| $1,525,000 | None Available |
Mortgage History
We collect this data history from publicly available records. To have your information removed, we recommend requesting removal directly through your county’s website.
| Date | Status | Borrower | Loan Amount |
|---|---|---|---|
| Open | $800,000 |
Tax History
We collect this data history from publicly available records. To have your information removed, we recommend requesting removal directly through your county’s website.
| Year | Tax Paid | Tax Assessment Tax Assessment Total Assessment is a certain percentage of the fair market value that is determined by local assessors to be the total taxable value of land and additions on the property. | Land | Improvement |
|---|---|---|---|---|
| 2025 | $17,614 | $1,525,000 | $791,800 | $733,200 |
| 2024 | $17,400 | $1,525,000 | $791,800 | $733,200 |
| 2023 | $17,126 | $1,525,000 | $791,800 | $733,200 |
| 2022 | $17,126 | $1,525,000 | $791,800 | $733,200 |
| 2021 | $13,165 | $1,525,000 | $791,800 | $733,200 |
| 2020 | $17,553 | $1,525,000 | $791,800 | $733,200 |
| 2019 | $16,485 | $1,525,000 | $791,800 | $733,200 |
| 2018 | $15,906 | $1,525,000 | $791,800 | $733,200 |
| 2017 | $15,220 | $1,525,000 | $791,800 | $733,200 |
| 2016 | $16,763 | $1,712,300 | $791,800 | $920,500 |
| 2015 | $15,924 | $1,712,300 | $791,800 | $920,500 |
| 2014 | $14,897 | $1,712,300 | $791,800 | $920,500 |
Map
- 29 Roslyn Ave
- 11 Raymond St
- 140 Demarest Ave
- 144 Demarest Ave
- 485 E Palisade Ave
- 12 Beverly Rd
- 577 Floyd St
- 30 Skyline Dr
- 3 Daniel Dr
- 48 Cambridge Place
- 655 Floyd St
- 22 Berkshire Place
- 231 N Woodland St
- 188 Charlotte Place
- 153 Charlotte Place
- 200 Lincoln St
- 285 Maple St
- 320 Bolz St
- 292 Maple St
- 316 Bolz St
Ask me questions while you tour the home.