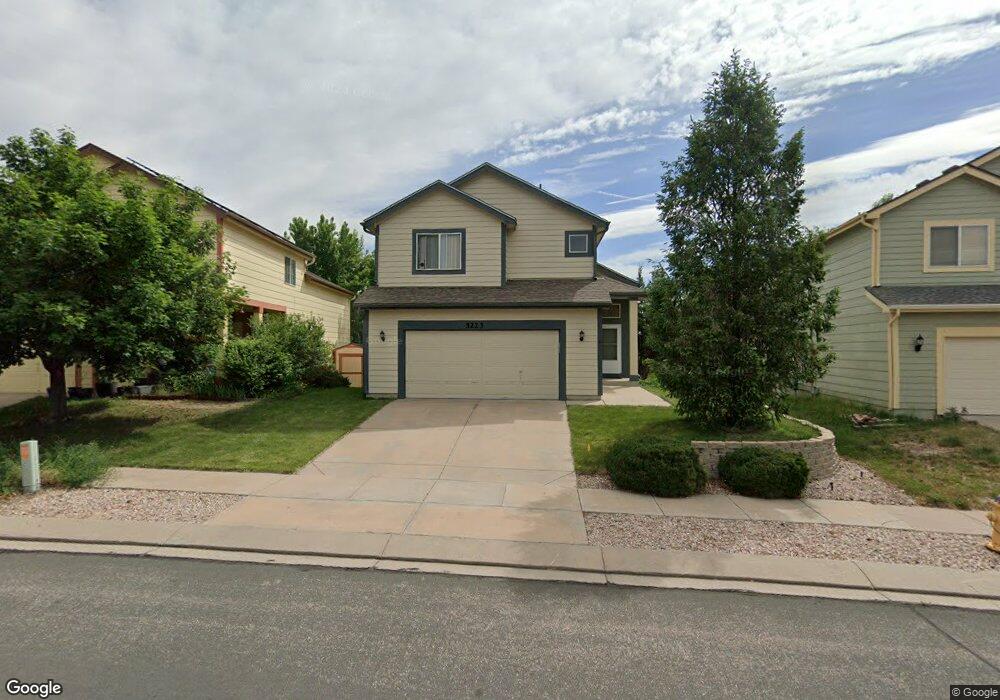
5223 Blackcloud Loop Colorado Springs, CO 80922
Stetson Hills NeighborhoodEstimated Value: $417,353 - $448,000
4
Beds
4
Baths
1,532
Sq Ft
$285/Sq Ft
Est. Value
About This Home
This home is located at 5223 Blackcloud Loop, Colorado Springs, CO 80922 and is currently estimated at $436,088, approximately $284 per square foot. 5223 Blackcloud Loop is a home located in El Paso County with nearby schools including Odyssey Elementary School, Skyview Middle School, and Vista Ridge High School.
Ownership History
Date
Name
Owned For
Owner Type
Purchase Details
Closed on
Nov 21, 2001
Sold by
Maddox Beam Lisa and Maddox Lisa
Bought by
Beam Christopher
Current Estimated Value
Home Financials for this Owner
Home Financials are based on the most recent Mortgage that was taken out on this home.
Original Mortgage
$157,000
Outstanding Balance
$60,685
Interest Rate
6.57%
Estimated Equity
$375,403
Purchase Details
Closed on
Jul 28, 2000
Sold by
Smook Douglas W
Bought by
Beam Christopher and Maddox Beam Lisa
Home Financials for this Owner
Home Financials are based on the most recent Mortgage that was taken out on this home.
Original Mortgage
$154,850
Interest Rate
8.15%
Purchase Details
Closed on
Jul 25, 1997
Sold by
U S Home Corp
Bought by
Smook Douglas W
Home Financials for this Owner
Home Financials are based on the most recent Mortgage that was taken out on this home.
Original Mortgage
$130,156
Interest Rate
7.6%
Mortgage Type
VA
Create a Home Valuation Report for This Property
The Home Valuation Report is an in-depth analysis detailing your home's value as well as a comparison with similar homes in the area
Home Values in the Area
Average Home Value in this Area
Purchase History
| Date | Buyer | Sale Price | Title Company |
|---|---|---|---|
| Beam Christopher | -- | North American Title | |
| Beam Christopher | $163,000 | Stewart Title | |
| Smook Douglas W | $126,366 | Stewart Title |
Source: Public Records
Mortgage History
| Date | Status | Borrower | Loan Amount |
|---|---|---|---|
| Open | Beam Christopher | $157,000 | |
| Closed | Beam Christopher | $154,850 | |
| Previous Owner | Smook Douglas W | $130,156 |
Source: Public Records
Tax History
| Year | Tax Paid | Tax Assessment Tax Assessment Total Assessment is a certain percentage of the fair market value that is determined by local assessors to be the total taxable value of land and additions on the property. | Land | Improvement |
|---|---|---|---|---|
| 2025 | $1,672 | $30,320 | -- | -- |
| 2024 | $1,572 | $30,280 | $4,620 | $25,660 |
| 2023 | $1,572 | $30,280 | $4,620 | $25,660 |
| 2022 | $1,384 | $22,260 | $4,170 | $18,090 |
| 2021 | $1,441 | $22,900 | $4,290 | $18,610 |
| 2020 | $1,245 | $19,560 | $3,580 | $15,980 |
| 2019 | $1,232 | $19,560 | $3,580 | $15,980 |
| 2018 | $1,007 | $15,690 | $3,020 | $12,670 |
| 2017 | $1,012 | $15,690 | $3,020 | $12,670 |
| 2016 | $1,020 | $15,600 | $2,950 | $12,650 |
| 2015 | $1,021 | $15,600 | $2,950 | $12,650 |
| 2014 | $941 | $14,120 | $2,790 | $11,330 |
Source: Public Records
Map
Nearby Homes
- 6315 Basalt Ct
- 6260 Silverado Trail
- 4923 Fabray Ln
- 4695 Badlands Ct
- 4917 Copen Dr
- 4911 Copen Dr
- 4860 Findon Place
- 6135 Padre Ct
- 5353 Palomino Ranch Point Unit 206
- 5209 Palomino Ranch Point
- 4801 Sweetgrass Ln
- 5201 Palomino Ranch Point
- 5208 Prairie Grass Ln
- 5153 Palomino Ranch Point
- 5289 Palomino Ranch Point
- 5436 Vermillion Bluffs Dr
- 4825 Halter Ct
- 5922 Instone Cir
- 6628 Cache Dr
- 5653 Tomiche Dr
- 5229 Blackcloud Loop
- 5217 Blackcloud Loop
- 5235 Blackcloud Loop
- 5211 Blackcloud Loop
- 5184 Blackcloud Loop
- 5241 Blackcloud Loop
- 5205 Blackcloud Loop
- 5015 Ophir Ct
- 5025 Ophir Ct
- 5247 Blackcloud Loop
- 5177 Blackcloud Loop
- 5178 Blackcloud Loop
- 5035 Ophir Ct
- 5253 Blackcloud Loop
- 5171 Blackcloud Loop
- 5172 Blackcloud Loop
- 6380 Naturita Trail
- 5254 Blackcloud Loop
- 5166 Blackcloud Loop
- 5259 Blackcloud Loop
Your Personal Tour Guide
Ask me questions while you tour the home.