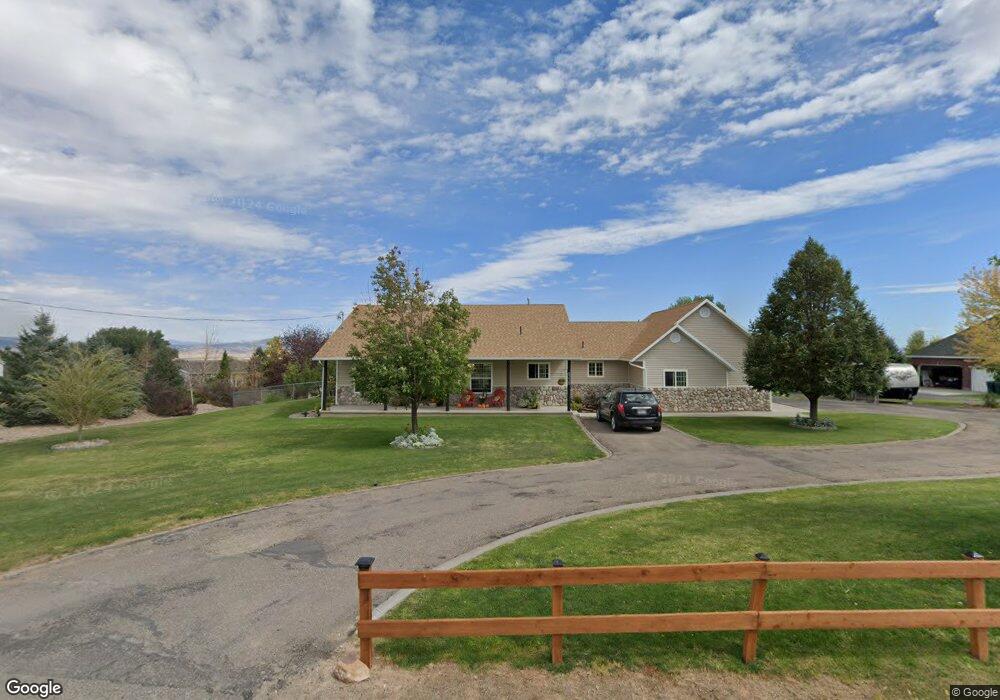
5228 S 500 E Vernal, UT 84078
Estimated Value: $450,000 - $587,000
3
Beds
3
Baths
3,372
Sq Ft
$160/Sq Ft
Est. Value
About This Home
This home is located at 5228 S 500 E, Vernal, UT 84078 and is currently estimated at $539,598, approximately $160 per square foot. 5228 S 500 E is a home located in Uintah County with nearby schools including Davis School, Vernal Middle School, and Uintah Middle School.
Ownership History
Date
Name
Owned For
Owner Type
Purchase Details
Closed on
Oct 1, 2021
Sold by
Lawrence S Brown Trust and Sue Beard Megan
Bought by
Emery Dave
Current Estimated Value
Home Financials for this Owner
Home Financials are based on the most recent Mortgage that was taken out on this home.
Original Mortgage
$344,000
Outstanding Balance
$308,892
Interest Rate
2.8%
Mortgage Type
New Conventional
Estimated Equity
$230,706
Purchase Details
Closed on
Oct 25, 2012
Sold by
Willow Bend Property Company Llc
Bought by
Willow Park Properties Ii Llc
Create a Home Valuation Report for This Property
The Home Valuation Report is an in-depth analysis detailing your home's value as well as a comparison with similar homes in the area
Purchase History
| Date | Buyer | Sale Price | Title Company |
|---|---|---|---|
| Emery Dave | -- | None Listed On Document | |
| Willow Park Properties Ii Llc | -- | Basin Land Title |
Source: Public Records
Mortgage History
| Date | Status | Borrower | Loan Amount |
|---|---|---|---|
| Open | Emery Dave | $344,000 |
Source: Public Records
Tax History
| Year | Tax Paid | Tax Assessment Tax Assessment Total Assessment is a certain percentage of the fair market value that is determined by local assessors to be the total taxable value of land and additions on the property. | Land | Improvement |
|---|---|---|---|---|
| 2024 | $2,295 | $264,252 | $24,647 | $239,605 |
| 2023 | $2,221 | $231,203 | $24,647 | $206,556 |
| 2022 | $1,960 | $189,892 | $24,647 | $165,245 |
| 2021 | $1,767 | $77,308 | $13,556 | $63,752 |
| 2020 | $1,606 | $131,155 | $20,750 | $110,405 |
| 2019 | $1,536 | $123,932 | $20,750 | $103,182 |
| 2018 | $1,473 | $119,019 | $20,750 | $98,269 |
| 2017 | $14 | $119,019 | $20,750 | $98,269 |
| 2016 | $1,375 | $122,058 | $20,750 | $101,308 |
| 2015 | $1,293 | $124,546 | $23,600 | $100,946 |
| 2014 | $1,219 | $118,833 | $23,600 | $95,233 |
| 2013 | $1,245 | $118,833 | $23,600 | $95,233 |
Source: Public Records
Map
Nearby Homes
Your Personal Tour Guide
Ask me questions while you tour the home.