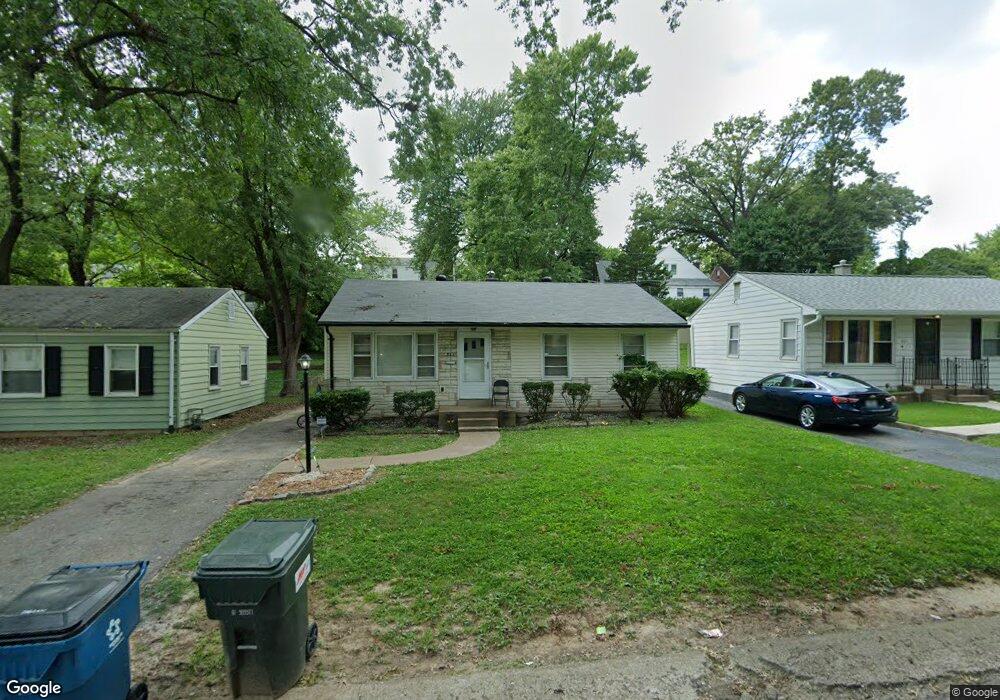
525 Teston Dr Saint Louis, MO 63135
Estimated Value: $110,176 - $114,000
3
Beds
2
Baths
864
Sq Ft
$131/Sq Ft
Est. Value
About This Home
This home is located at 525 Teston Dr, Saint Louis, MO 63135 and is currently estimated at $112,794, approximately $130 per square foot. 525 Teston Dr is a home located in St. Louis County with nearby schools including Lee Hamilton Elementary School, Ferguson Middle School, and McCluer High School.
Ownership History
Date
Name
Owned For
Owner Type
Purchase Details
Closed on
Jan 21, 2014
Sold by
Webster Jerome S
Bought by
Webster Jerome S and Webster Felice C
Current Estimated Value
Home Financials for this Owner
Home Financials are based on the most recent Mortgage that was taken out on this home.
Original Mortgage
$45,500
Outstanding Balance
$34,455
Interest Rate
4.47%
Mortgage Type
New Conventional
Estimated Equity
$78,339
Purchase Details
Closed on
Apr 11, 2011
Sold by
Hsbc Mortgage Services Inc
Bought by
Webster Jerome S
Home Financials for this Owner
Home Financials are based on the most recent Mortgage that was taken out on this home.
Original Mortgage
$32,065
Interest Rate
5.5%
Mortgage Type
FHA
Purchase Details
Closed on
Jan 19, 2011
Sold by
Jenkins Kenneth R
Bought by
Hsbc Mortgage Services Inc
Purchase Details
Closed on
Apr 19, 2000
Sold by
Hammond Boyd J and Hammond Irene C
Bought by
Jenkins Kenneth R
Home Financials for this Owner
Home Financials are based on the most recent Mortgage that was taken out on this home.
Original Mortgage
$67,769
Interest Rate
8.21%
Create a Home Valuation Report for This Property
The Home Valuation Report is an in-depth analysis detailing your home's value as well as a comparison with similar homes in the area
Home Values in the Area
Average Home Value in this Area
Purchase History
We collect this data history from publicly available records. To have your information removed, we recommend requesting removal directly through your county’s website.
| Date | Buyer | Sale Price | Title Company |
|---|---|---|---|
| Webster Jerome S | -- | Multiple | |
| Webster Jerome S | $32,900 | Ust | |
| Hsbc Mortgage Services Inc | $31,955 | None Available | |
| Jenkins Kenneth R | $61,900 | -- |
Source: Public Records
Mortgage History
We collect this data history from publicly available records. To have your information removed, we recommend requesting removal directly through your county’s website.
| Date | Status | Borrower | Loan Amount |
|---|---|---|---|
| Open | Webster Jerome S | $45,500 | |
| Closed | Webster Jerome S | $32,065 | |
| Previous Owner | Jenkins Kenneth R | $67,769 |
Source: Public Records
Tax History
| Year | Tax Paid | Tax Assessment Tax Assessment Total Assessment is a certain percentage of the fair market value that is determined by local assessors to be the total taxable value of land and additions on the property. | Land | Improvement |
|---|---|---|---|---|
| 2025 | $1,188 | $21,990 | $2,320 | $19,670 |
| 2024 | $1,188 | $16,280 | $1,540 | $14,740 |
| 2023 | $1,182 | $16,280 | $1,540 | $14,740 |
| 2022 | $1,188 | $14,270 | $2,530 | $11,740 |
| 2021 | $1,150 | $14,270 | $2,530 | $11,740 |
| 2020 | $1,278 | $14,290 | $2,700 | $11,590 |
| 2019 | $1,254 | $14,290 | $2,700 | $11,590 |
| 2018 | $1,075 | $10,890 | $2,320 | $8,570 |
| 2017 | $1,054 | $10,890 | $2,320 | $8,570 |
| 2016 | $1,136 | $11,570 | $1,940 | $9,630 |
| 2015 | $1,143 | $11,570 | $1,940 | $9,630 |
| 2014 | $1,146 | $11,470 | $2,050 | $9,420 |
Source: Public Records
Map
Nearby Homes
- 700 N Elizabeth Ave
- 631 Robert Ave
- 400 Royal Ave
- 820 N Elizabeth Ave
- 311 Superior Dr
- 705 Palace Ct
- 212 Millman Dr
- 308 Superior Dr
- 425 Powell Ave
- 145 N Clay Ave
- 512 Coppinger Dr
- 6 Sandringham Ln
- 517 Plantmore Dr
- 511 Averill Ave
- 919 Robert Ave
- 35 Robert Ave
- 426 Darst Rd
- 324 Averill Ave
- 15 Hereford Ave
- 931 Thatcher Ave
- 521 Teston Dr
- 601 Teston Dr
- 517 Teston Dr
- 605 Teston Dr
- 448 N Elizabeth Ave
- 456 N Elizabeth Ave
- 444 N Elizabeth Ave
- 513 Teston Dr
- 609 Teston Dr
- 526 Teston Dr
- 460 N Elizabeth Ave
- 602 Teston Dr
- 522 Teston Dr
- 504 Robert Ave
- 518 Teston Dr
- 606 Teston Dr
- 509 Teston Dr
- 436 N Elizabeth Ave
- 464 N Elizabeth Ave
- 514 Teston Dr
Your Personal Tour Guide
Ask me questions while you tour the home.