Estimated Value: $192,877 - $216,000
Studio
1
Bath
2,140
Sq Ft
$96/Sq Ft
Est. Value
About This Home
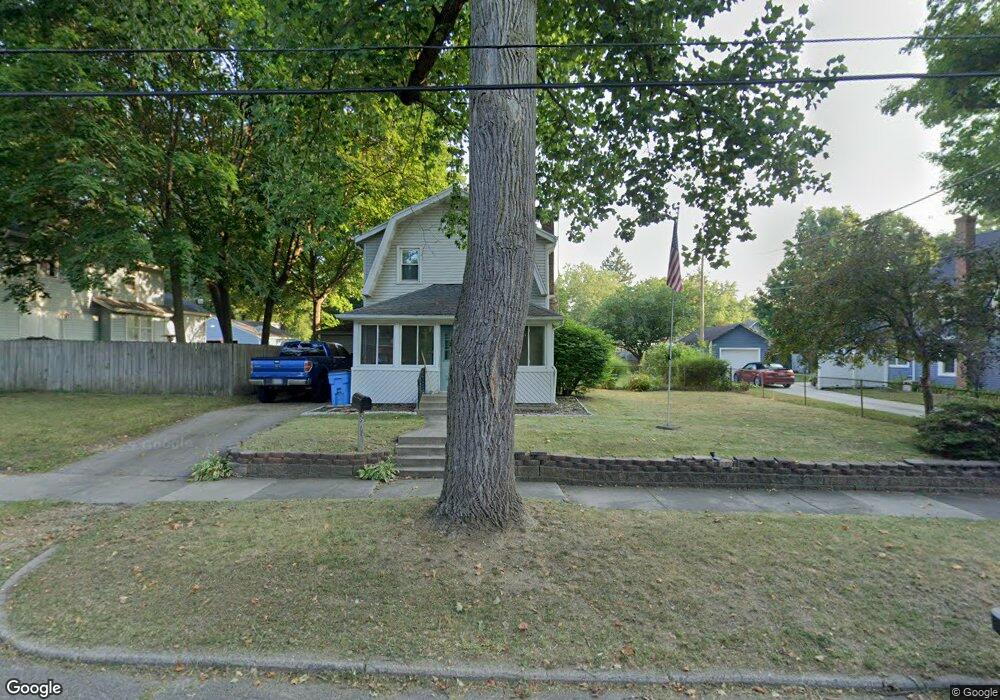
This home is located at 527 Union St, Niles, MI 49120 and is currently estimated at $205,219, approximately $95 per square foot. 527 Union St is a home located in Berrien County with nearby schools including Ballard Elementary School, Oak Manor Sixth Grade Center, and Ring Lardner Middle School.
Ownership History
Date
Name
Owned For
Owner Type
Purchase Details
Closed on
Dec 1, 2020
Sold by
Olinghouse Richard and Olinghouse Margaret
Bought by
Olinghouse Ryan J
Current Estimated Value
Home Financials for this Owner
Home Financials are based on the most recent Mortgage that was taken out on this home.
Original Mortgage
$96,500
Outstanding Balance
$86,067
Interest Rate
2.8%
Mortgage Type
VA
Estimated Equity
$119,152
Purchase Details
Closed on
Apr 15, 1996
Purchase Details
Closed on
Aug 7, 1985
Create a Home Valuation Report for This Property
The Home Valuation Report is an in-depth analysis detailing your home's value as well as a comparison with similar homes in the area
Home Values in the Area
Average Home Value in this Area
Purchase History
| Date | Buyer | Sale Price | Title Company |
|---|---|---|---|
| Olinghouse Ryan J | $96,500 | Accommodation | |
| -- | -- | -- | |
| -- | $27,800 | -- |
Source: Public Records
Mortgage History
| Date | Status | Borrower | Loan Amount |
|---|---|---|---|
| Open | Olinghouse Ryan J | $96,500 |
Source: Public Records
Tax History
| Year | Tax Paid | Tax Assessment Tax Assessment Total Assessment is a certain percentage of the fair market value that is determined by local assessors to be the total taxable value of land and additions on the property. | Land | Improvement |
|---|---|---|---|---|
| 2025 | $1,533 | $93,300 | $0 | $0 |
| 2024 | $1,205 | $86,800 | $0 | $0 |
| 2023 | $1,155 | $76,300 | $0 | $0 |
| 2022 | $1,100 | $57,600 | $0 | $0 |
| 2021 | $1,349 | $50,400 | $4,900 | $45,500 |
| 2020 | $1,335 | $52,200 | $0 | $0 |
| 2019 | $1,318 | $38,600 | $2,200 | $36,400 |
| 2018 | $1,275 | $38,600 | $0 | $0 |
| 2017 | $1,254 | $32,900 | $0 | $0 |
| 2016 | $1,336 | $36,900 | $0 | $0 |
| 2015 | $1,332 | $39,400 | $0 | $0 |
| 2014 | $1,042 | $39,200 | $0 | $0 |
Source: Public Records
Map
Nearby Homes
- 11 N Barrett St
- 509 N State St
- 124 S State St
- 117 N Fairview Ave
- 26 S Fairview Ave
- 413 S Street Joseph Ave
- 707 Platt St
- 926 Birch St
- 518 Earl Ct
- 1290 Missions East Dr
- 316 N 5th St
- 1050 Pine St
- 721 N 4th St
- 319 S 5th St
- 527 Howard St
- 724 Hickory St
- 211 N 8th St
- V/L Wesaw Rd
- 728 Chippewa Trail
- 911 Hickory St
Your Personal Tour Guide
Ask me questions while you tour the home.