5275 Capes Loop Oceanside, OR 97134
Estimated Value: $845,000 - $915,000
2
Beds
3
Baths
1,995
Sq Ft
$439/Sq Ft
Est. Value
About This Home
This home is located at 5275 Capes Loop, Oceanside, OR 97134 and is currently estimated at $876,331, approximately $439 per square foot. 5275 Capes Loop is a home located in Tillamook County with nearby schools including Tillamook High School.
Ownership History
Date
Name
Owned For
Owner Type
Purchase Details
Closed on
Aug 31, 2023
Sold by
Sylvi N Larsen Trust
Bought by
Larsen Family Osmp Trust and Larsen
Current Estimated Value
Purchase Details
Closed on
Mar 22, 2017
Sold by
Larsen Walter G and Larsen Sylvi N
Bought by
Larsen Walter G and Walter G Larsen Trust
Create a Home Valuation Report for This Property
The Home Valuation Report is an in-depth analysis detailing your home's value as well as a comparison with similar homes in the area
Purchase History
| Date | Buyer | Sale Price | Title Company |
|---|---|---|---|
| Larsen Family Osmp Trust | -- | None Listed On Document | |
| Larsen Walter G | -- | None Available | |
| Larsen Sylvi N | -- | None Available |
Source: Public Records
Tax History
| Year | Tax Paid | Tax Assessment Tax Assessment Total Assessment is a certain percentage of the fair market value that is determined by local assessors to be the total taxable value of land and additions on the property. | Land | Improvement |
|---|---|---|---|---|
| 2025 | $6,013 | $469,890 | $264,110 | $205,780 |
| 2024 | $5,746 | $456,210 | $256,420 | $199,790 |
| 2023 | $5,724 | $442,930 | $248,950 | $193,980 |
| 2022 | $5,564 | $430,030 | $241,700 | $188,330 |
| 2021 | $5,437 | $417,510 | $234,650 | $182,860 |
| 2020 | $5,318 | $405,350 | $227,810 | $177,540 |
| 2019 | $5,208 | $393,550 | $221,170 | $172,380 |
| 2018 | $5,065 | $382,090 | $214,730 | $167,360 |
| 2017 | $4,962 | $370,970 | $208,470 | $162,500 |
| 2016 | $4,850 | $360,170 | $202,400 | $157,770 |
| 2015 | $4,776 | $349,680 | $196,510 | $153,170 |
| 2014 | $4,716 | $339,500 | $190,790 | $148,710 |
| 2013 | -- | $329,620 | $185,240 | $144,380 |
Source: Public Records
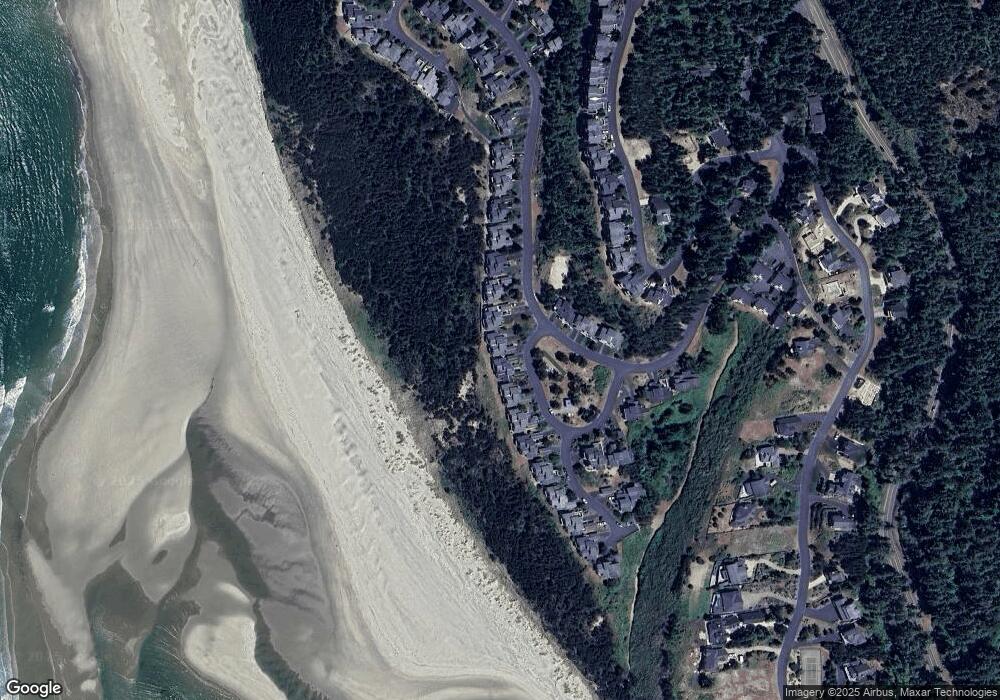
Map
Nearby Homes
- 505 W Capes Loop Dr W
- 455 Capes Dr
- 505 Capes Dr Unit 2
- 505 Capes Dr Unit 3
- 505 Capes Dr
- 505 Capes #2 Loop W Unit 2
- 415 Fall Creek Dr
- 110 Crescent St
- Lots 6,7,8 Glenwood St
- 5455 W Regent St
- 12 & 13 Crescent St
- 0 Crescent St Unit 12&13 614513147
- 120 Crescent St
- 140 Breezee Way
- 140 Breezee Way
- 2620/2621 Breezee Way
- TL 2618 Breezee Way
- 0 Breezee Way Unit 2Lots 24287783
- 120 Reeder St
- 0 Breezee Way Tl 2618
- 5275 Capes Loop
- 5265 Capes Loop
- 5265 Capes Loop
- 5285 Capes Loop
- 5215 Capes Loop
- 5215 Capes Loop Unit 27
- 5255 Capes Loop
- 5255 Capes Loop
- 433 Capes Dr
- 425 Capes Dr
- 5245 Capes Dr
- 5245 Capes Dr Unit The Capes
- 5245 Capes Loop
- 5245 Capes Loop
- 425 Capes Dr
- 5235 Capes Loop
- 405 Capes Dr Unit 37
- 405 Capes Dr
- 5225 Capes Loop
- 415 Capes Dr
Your Personal Tour Guide
Ask me questions while you tour the home.