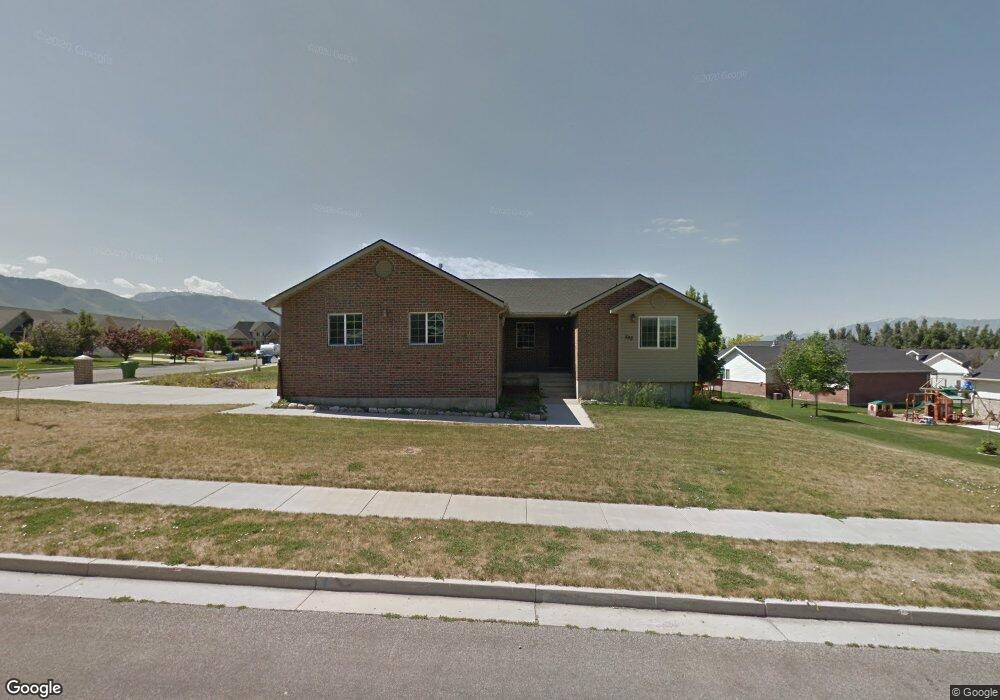
528 E 420 S Smithfield, UT 84335
Estimated Value: $548,000 - $572,564
5
Beds
4
Baths
3,353
Sq Ft
$168/Sq Ft
Est. Value
About This Home
This home is located at 528 E 420 S, Smithfield, UT 84335 and is currently estimated at $563,641, approximately $168 per square foot. 528 E 420 S is a home located in Cache County with nearby schools including Sunrise School, Cedar Ridge School, and North Cache Middle School.
Ownership History
Date
Name
Owned For
Owner Type
Purchase Details
Closed on
Jan 5, 2015
Sold by
U S Bank National Association
Bought by
Fielding Amy
Current Estimated Value
Purchase Details
Closed on
Jul 11, 2014
Sold by
Oberhansley Craig C and Oberhansley Cheryl A
Bought by
U S Bank National Association
Create a Home Valuation Report for This Property
The Home Valuation Report is an in-depth analysis detailing your home's value as well as a comparison with similar homes in the area
Home Values in the Area
Average Home Value in this Area
Purchase History
| Date | Buyer | Sale Price | Title Company |
|---|---|---|---|
| Fielding Amy | -- | Meridian Title Company | |
| U S Bank National Association | $177,802 | Trustees Title & Escrow |
Source: Public Records
Tax History
| Year | Tax Paid | Tax Assessment Tax Assessment Total Assessment is a certain percentage of the fair market value that is determined by local assessors to be the total taxable value of land and additions on the property. | Land | Improvement |
|---|---|---|---|---|
| 2025 | $2,259 | $302,350 | $0 | $0 |
| 2024 | $2,145 | $269,370 | $0 | $0 |
| 2023 | $2,244 | $266,475 | $0 | $0 |
| 2022 | $2,280 | $266,475 | $0 | $0 |
| 2021 | $2,255 | $402,600 | $75,000 | $327,600 |
| 2020 | $2,066 | $344,065 | $75,000 | $269,065 |
| 2019 | $2,035 | $323,065 | $54,000 | $269,065 |
| 2018 | $1,876 | $287,970 | $54,000 | $233,970 |
| 2017 | $1,749 | $146,685 | $0 | $0 |
| 2016 | $1,780 | $146,685 | $0 | $0 |
| 2015 | $1,452 | $119,205 | $0 | $0 |
| 2014 | $1,436 | $120,195 | $0 | $0 |
| 2013 | -- | $120,195 | $0 | $0 |
Source: Public Records
Map
Nearby Homes
- 442 S 455 E
- 396 S 455 E
- 641 S 380 E
- 127 S 830 E Unit 304
- 161 E 560 S
- 1400 E 300 S
- 145 E 650 S
- 805 S 270 E Unit 1
- 809 S 270 E Unit 2
- 813 S 270 E Unit 3
- 817 S 270 E Unit 4
- 821 S 270 E Unit 5
- 825 S 270 E Unit 6
- 118 E 620 S
- 434 S Cardon Ridge Dr
- 219 E 830 S
- 206 S 100 E
- 1092 E 300 S
- 641 S 1080 E Unit 44
- 670 S 1080 E Unit 37
Your Personal Tour Guide
Ask me questions while you tour the home.