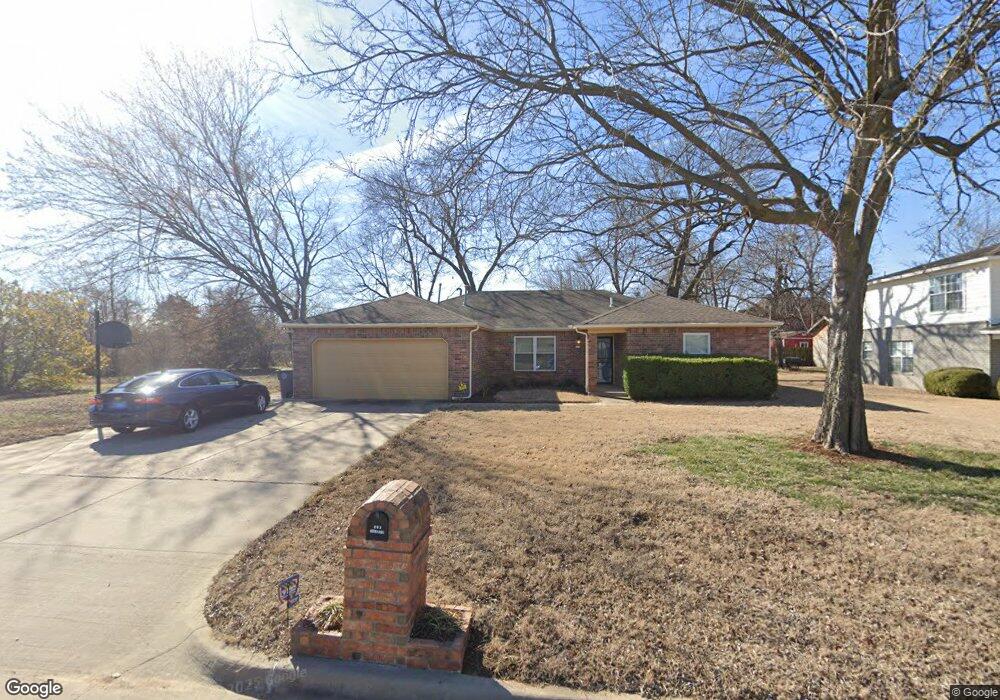
528 E Reading St Tulsa, OK 74106
Dunbar NeighborhoodEstimated Value: $181,896 - $230,000
Studio
2
Baths
1,768
Sq Ft
$114/Sq Ft
Est. Value
About This Home
This home is located at 528 E Reading St, Tulsa, OK 74106 and is currently estimated at $201,974, approximately $114 per square foot. 528 E Reading St is a home located in Tulsa County with nearby schools including Burroughs Elementary School, Central Middle School, and Central High School.
Ownership History
Date
Name
Owned For
Owner Type
Purchase Details
Closed on
Nov 22, 1999
Sold by
Hooks Ralph and Hooks Sheila
Bought by
Jackson Randy C
Current Estimated Value
Create a Home Valuation Report for This Property
The Home Valuation Report is an in-depth analysis detailing your home's value as well as a comparison with similar homes in the area
Home Values in the Area
Average Home Value in this Area
Purchase History
| Date | Buyer | Sale Price | Title Company |
|---|---|---|---|
| Jackson Randy C | -- | -- |
Source: Public Records
Tax History
| Year | Tax Paid | Tax Assessment Tax Assessment Total Assessment is a certain percentage of the fair market value that is determined by local assessors to be the total taxable value of land and additions on the property. | Land | Improvement |
|---|---|---|---|---|
| 2025 | $1,604 | $11,971 | $437 | $11,534 |
| 2024 | $1,425 | $11,593 | $507 | $11,086 |
| 2023 | $1,425 | $12,227 | $616 | $11,611 |
| 2022 | $1,449 | $10,870 | $629 | $10,241 |
| 2021 | $1,436 | $10,870 | $629 | $10,241 |
| 2020 | $1,416 | $10,870 | $629 | $10,241 |
| 2019 | $1,489 | $10,870 | $629 | $10,241 |
| 2018 | $1,493 | $10,870 | $629 | $10,241 |
| 2017 | $1,490 | $11,870 | $687 | $11,183 |
| 2016 | $1,416 | $11,545 | $668 | $10,877 |
| 2015 | $1,373 | $11,209 | $649 | $10,560 |
| 2014 | $1,360 | $11,209 | $649 | $10,560 |
Source: Public Records
Map
Nearby Homes
- 431 E Seminole Place
- 1601 N Detroit Ave
- 402 E Tecumseh St
- 520 E Oklahoma St
- 1611 N Boston Place
- 759 E Queen St N
- 728 E Tecumseh St
- 1604 N Boston Place
- 1337 N Boston Place
- 2225 N Main St
- 1420 N Boston Ave
- 1435 N Main St Unit A-B
- 1544 N Main St
- 304 E Woodrow Place
- 1961 N Boston Place
- 1014 E Pine Place
- 1448 N Main St Unit 2
- 1448 N Main St Unit 3
- 1448 N Main St Unit 1
- 1340 N Boston Ave
- 520 E Reading St
- 536 E Reading St
- 516 E Reading St
- 525 E Queen St
- 521 E Queen St
- 531 E Queen St
- 515 E Queen St
- 535 E Queen St
- 523 E Reading St
- 531 E Reading St
- 540 E Reading St
- 535 E Reading St
- 515 E Reading St
- 1563 N Frankfort Ave
- 1705 N Frankfort Ave
- 1605 N Frankfort Place
- 544 E Reading St
- 1707 N Frankfort Ave
- 1559 N Frankfort Ave
- 541 E Reading St
Your Personal Tour Guide
Ask me questions while you tour the home.