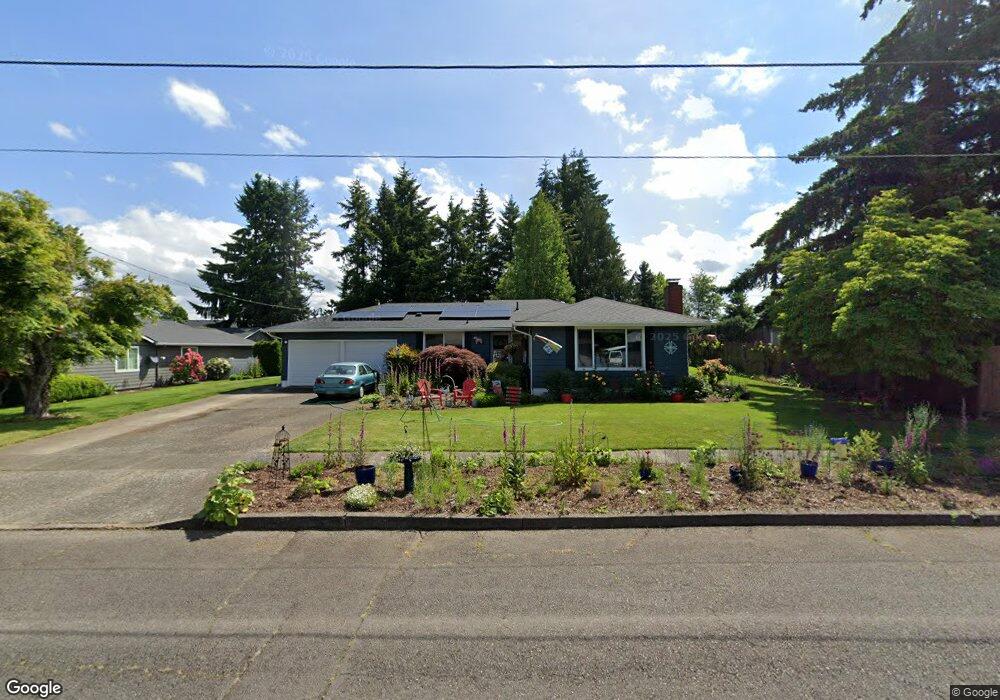
528 NE Pine St Sublimity, OR 97385
Estimated Value: $469,000 - $571,000
3
Beds
3
Baths
1,804
Sq Ft
$295/Sq Ft
Est. Value
About This Home
This home is located at 528 NE Pine St, Sublimity, OR 97385 and is currently estimated at $531,820, approximately $294 per square foot. 528 NE Pine St is a home located in Marion County with nearby schools including Sublimity Elementary School, Stayton High School, and St. Mary Catholic School.
Ownership History
Date
Name
Owned For
Owner Type
Purchase Details
Closed on
Mar 3, 2021
Sold by
Myers Grant E and Myers Michele M
Bought by
Myers Grant E and Myers Michele M
Current Estimated Value
Home Financials for this Owner
Home Financials are based on the most recent Mortgage that was taken out on this home.
Original Mortgage
$125,400
Outstanding Balance
$90,384
Interest Rate
2.7%
Mortgage Type
New Conventional
Estimated Equity
$441,436
Purchase Details
Closed on
Sep 8, 2004
Sold by
Kallis Ronald J
Bought by
Myers Grant E and Myers Michele M
Home Financials for this Owner
Home Financials are based on the most recent Mortgage that was taken out on this home.
Original Mortgage
$127,520
Interest Rate
5.94%
Mortgage Type
Purchase Money Mortgage
Purchase Details
Closed on
Aug 29, 2003
Sold by
Norton Richard W and Norton Yoshiko
Bought by
Kallis Ronald J and Richard W Norton Living Trust
Create a Home Valuation Report for This Property
The Home Valuation Report is an in-depth analysis detailing your home's value as well as a comparison with similar homes in the area
Home Values in the Area
Average Home Value in this Area
Purchase History
| Date | Buyer | Sale Price | Title Company |
|---|---|---|---|
| Myers Grant E | -- | First American | |
| Myers Grant E | $159,400 | First American | |
| Kallis Ronald J | -- | -- |
Source: Public Records
Mortgage History
| Date | Status | Borrower | Loan Amount |
|---|---|---|---|
| Open | Myers Grant E | $125,400 | |
| Closed | Myers Grant E | $127,520 | |
| Closed | Myers Grant E | $15,940 |
Source: Public Records
Tax History
| Year | Tax Paid | Tax Assessment Tax Assessment Total Assessment is a certain percentage of the fair market value that is determined by local assessors to be the total taxable value of land and additions on the property. | Land | Improvement |
|---|---|---|---|---|
| 2025 | $3,079 | $248,960 | -- | -- |
| 2024 | $3,079 | $241,710 | -- | -- |
| 2023 | $2,992 | $234,670 | $0 | $0 |
| 2022 | $2,676 | $218,660 | $0 | $0 |
| 2021 | $2,602 | $212,300 | $0 | $0 |
| 2020 | $2,528 | $206,120 | $0 | $0 |
| 2019 | $2,453 | $200,120 | $0 | $0 |
| 2018 | $2,488 | $0 | $0 | $0 |
| 2017 | $2,423 | $0 | $0 | $0 |
| 2016 | $2,358 | $0 | $0 | $0 |
| 2015 | $2,286 | $0 | $0 | $0 |
| 2014 | $2,207 | $0 | $0 | $0 |
Source: Public Records
Map
Nearby Homes
- 459 NE Cedar St
- 545 NE Overlook Way
- 309 NE Berry St
- 340 NE Crest St Unit 5
- 0 NE Broadway (Lot Unit 2) St 827578
- 0 NE Clay (Lot Unit 9) St
- 0 NE Broadway (Lot Unit 1) St 827577
- 0 NE Clay (Lot Unit 12) St
- 0 NE Broadway (Lot Unit 3) St
- 0 NE Broadway (Lot Unit 8) St
- 313 NE Clay St
- 319 NE Clay St
- 311 NE Clay St
- 318 NE Clay St
- 315 NE Clay St
- 232 NE Broadway St
- 228 NE Broadway St
- 222 NE Broadway St
- 215 NE Broadway St
- 211 NE Broadway St
- 544 NE Pine St
- 519 NE Cherry St
- 527 NE Cherry St
- 515 NE Cherry St
- 450 NE Pine St
- 454 NE Pine St
- 572 NE Pine St
- 539 NE Cherry St
- 522 NE Hilltop Ct
- 504 NE Pine St
- 499 NE Cherry St
- 529 NE Pine St
- 543 NE Pine St
- 592 NE Pine St
- 534 NE Hilltop Ct
- 551 NE Cherry St
- 568 NE Cherry St
- 527 NE Hilltop Ct
- 572 NE Cherry St
- 573 NE Pine St
Your Personal Tour Guide
Ask me questions while you tour the home.