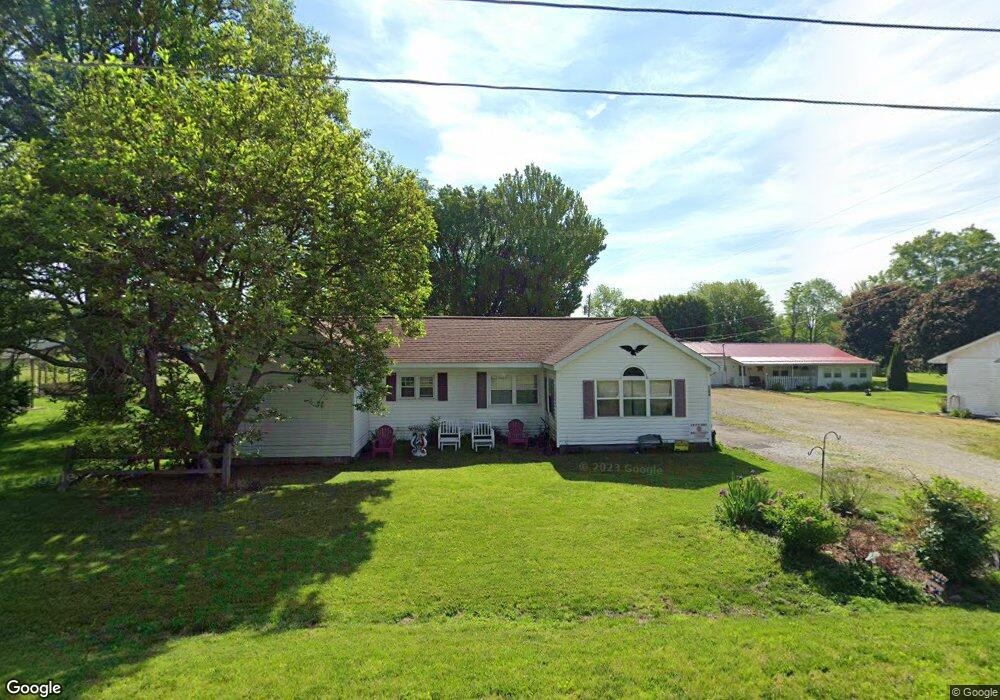
5284 N Main St Cayuga, IN 47928
Estimated Value: $93,000 - $138,000
2
Beds
1
Bath
1,423
Sq Ft
$79/Sq Ft
Est. Value
About This Home
This home is located at 5284 N Main St, Cayuga, IN 47928 and is currently estimated at $111,989, approximately $78 per square foot. 5284 N Main St is a home located in Vermillion County with nearby schools including North Vermillion Elementary School, North Vermillion High School, and RESCARE RESIDENTIAL PROGRAM.
Ownership History
Date
Name
Owned For
Owner Type
Purchase Details
Closed on
Feb 28, 2020
Sold by
Baxter Gregg
Bought by
Jackson Jeffrey W and Jackson Autumn K
Current Estimated Value
Purchase Details
Closed on
Oct 23, 2013
Sold by
Gregg
Bought by
Jeffrey W and Autumn K
Purchase Details
Closed on
Sep 27, 2013
Sold by
Baxter Gregg
Bought by
Jackson Jeffrey W and Jackson Autumn K
Purchase Details
Closed on
May 4, 2012
Sold by
Baxter Gregg E
Bought by
Porter Phillip K and Porter Linda L
Purchase Details
Closed on
Oct 12, 2011
Sold by
Brookshier Esther S
Bought by
Baxter Gregg E
Create a Home Valuation Report for This Property
The Home Valuation Report is an in-depth analysis detailing your home's value as well as a comparison with similar homes in the area
Purchase History
| Date | Buyer | Sale Price | Title Company |
|---|---|---|---|
| Jackson Jeffrey W | $50,000 | Wesch Law Firm | |
| Jeffrey W | $50,000 | Darnell Law Office | |
| Jackson Jeffrey W | $50,000 | -- | |
| Porter Phillip K | $60,000 | Wallace Law Firm | |
| Baxter Gregg E | $60,000 | -- | |
| Porter Phillip K | $60,000 | -- | |
| Baxter Gregg E | $25,000 | -- |
Source: Public Records
Tax History
| Year | Tax Paid | Tax Assessment Tax Assessment Total Assessment is a certain percentage of the fair market value that is determined by local assessors to be the total taxable value of land and additions on the property. | Land | Improvement |
|---|---|---|---|---|
| 2025 | $320 | $90,600 | $5,500 | $85,100 |
| 2024 | $320 | $71,700 | $5,500 | $66,200 |
| 2023 | $283 | $61,400 | $5,500 | $55,900 |
| 2022 | $303 | $59,300 | $2,800 | $56,500 |
| 2021 | $278 | $53,100 | $2,300 | $50,800 |
| 2020 | $207 | $51,700 | $3,600 | $48,100 |
| 2019 | $228 | $55,700 | $3,600 | $52,100 |
| 2018 | $220 | $55,700 | $3,600 | $52,100 |
| 2017 | $189 | $51,200 | $3,600 | $47,600 |
| 2016 | $148 | $44,000 | $3,600 | $40,400 |
| 2014 | $134 | $44,300 | $3,600 | $40,700 |
| 2013 | $134 | $41,400 | $3,600 | $37,800 |
Source: Public Records
Map
Nearby Homes
- 219 N Wabash St
- 404 S 8th St
- 612 Arrasmith Ave
- 908 S Division St
- 7796 N Meridian Rd
- 0 State Road 234
- 0 N 100 St W Unit 108460
- Lot 14 Mcclain Ave
- 7138 N State Line Rd
- 7200 State Line Rd
- 9015 Indiana 63
- Fox Tail Ln
- 1 1000 N
- 1000 N 300 W
- 3148 S Coffing Brothers Rd
- 3110 S Coffing Brothers Rd
- 2340 W Hibbs Rd
- 3500 E 160 N
- 1938 W
- 0 Stringtown South Rd
- 185 W Cherry St
- 5280 N Main St
- 215 W Cherry St
- 5279 N Main St
- 5377 N Water St
- 5377 N Water St
- 5270 N Main St
- 5368 N Main St
- 5233 N Water St
- 5241 N Water St
- 5367 N Main St
- 5376 N Main St
- 5375 N Main St
- 5270 N High St
- 5227 N Water St
- 5250 N Water St
- 5389 N Main St
- 246 W South St
- 5256 N High St
- 278 W Cherry St
Your Personal Tour Guide
Ask me questions while you tour the home.