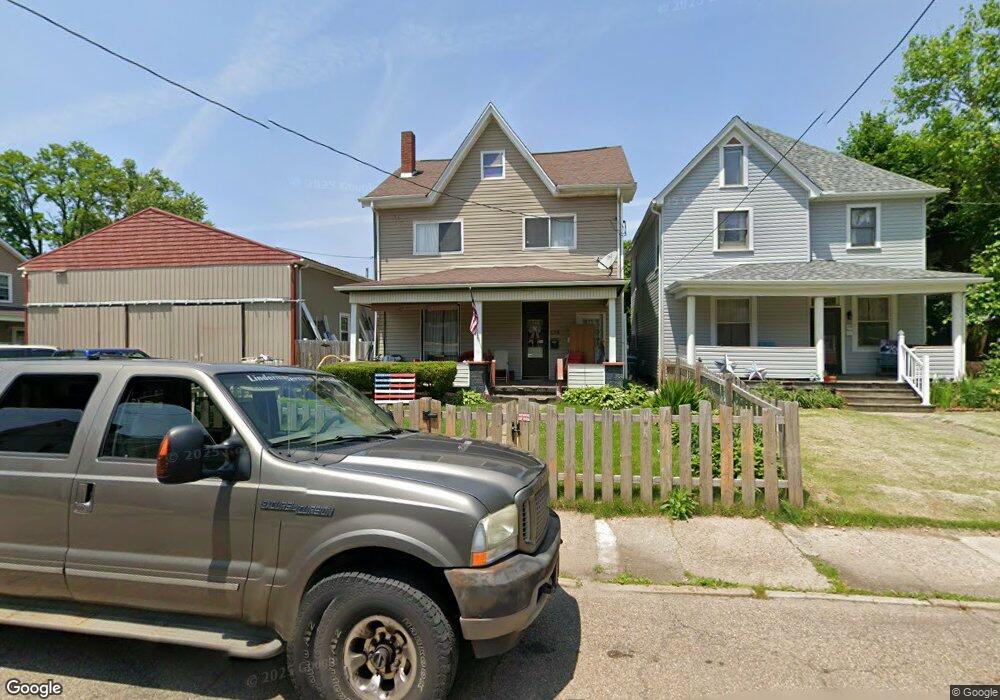
529 E 2nd Ave Tarentum, PA 15084
Estimated Value: $79,000 - $116,500
3
Beds
2
Baths
2,283
Sq Ft
$42/Sq Ft
Est. Value
About This Home
This home is located at 529 E 2nd Ave, Tarentum, PA 15084 and is currently estimated at $95,125, approximately $41 per square foot. 529 E 2nd Ave is a home located in Allegheny County with nearby schools including Highlands Senior High School, Mary Queen of Apostles School, and St. Joseph High School.
Ownership History
Date
Name
Owned For
Owner Type
Purchase Details
Closed on
Feb 23, 2018
Sold by
The Estate Of Orella Carol Lynn Deceased
Bought by
Linderman Kathleen O
Current Estimated Value
Purchase Details
Closed on
Nov 2, 2007
Sold by
Secy Of H U D
Bought by
Lynn Kathleen O
Home Financials for this Owner
Home Financials are based on the most recent Mortgage that was taken out on this home.
Original Mortgage
$68,157
Outstanding Balance
$43,323
Interest Rate
6.47%
Mortgage Type
FHA
Estimated Equity
$51,802
Purchase Details
Closed on
Jan 24, 1997
Sold by
Thompson John Ross
Bought by
Livingston Eric S
Create a Home Valuation Report for This Property
The Home Valuation Report is an in-depth analysis detailing your home's value as well as a comparison with similar homes in the area
Home Values in the Area
Average Home Value in this Area
Purchase History
We collect this data history from publicly available records. To have your information removed, we recommend requesting removal directly through your county’s website.
| Date | Buyer | Sale Price | Title Company |
|---|---|---|---|
| Linderman Kathleen O | -- | None Available | |
| Lynn Kathleen O | $23,001 | -- | |
| Livingston Eric S | $23,500 | -- |
Source: Public Records
Mortgage History
We collect this data history from publicly available records. To have your information removed, we recommend requesting removal directly through your county’s website.
| Date | Status | Borrower | Loan Amount |
|---|---|---|---|
| Open | Lynn Kathleen O | $68,157 |
Source: Public Records
Tax History
| Year | Tax Paid | Tax Assessment Tax Assessment Total Assessment is a certain percentage of the fair market value that is determined by local assessors to be the total taxable value of land and additions on the property. | Land | Improvement |
|---|---|---|---|---|
| 2025 | $1,272 | $36,000 | $9,900 | $26,100 |
| 2024 | $1,272 | $36,000 | $9,900 | $26,100 |
| 2023 | $1,272 | $36,000 | $9,900 | $26,100 |
| 2022 | $1,263 | $36,000 | $9,900 | $26,100 |
| 2021 | $1,263 | $36,000 | $9,900 | $26,100 |
| 2020 | $1,263 | $36,000 | $9,900 | $26,100 |
| 2019 | $1,254 | $36,000 | $9,900 | $26,100 |
| 2018 | $170 | $36,000 | $9,900 | $26,100 |
| 2017 | $1,224 | $36,000 | $9,900 | $26,100 |
| 2016 | $170 | $36,000 | $9,900 | $26,100 |
| 2015 | $170 | $36,000 | $9,900 | $26,100 |
| 2014 | $1,224 | $36,000 | $9,900 | $26,100 |
Source: Public Records
Map
Nearby Homes
Your Personal Tour Guide
Ask me questions while you tour the home.