53 Cabot Rd Danvers, MA 01923
Estimated Value: $683,322 - $715,000
About This Home
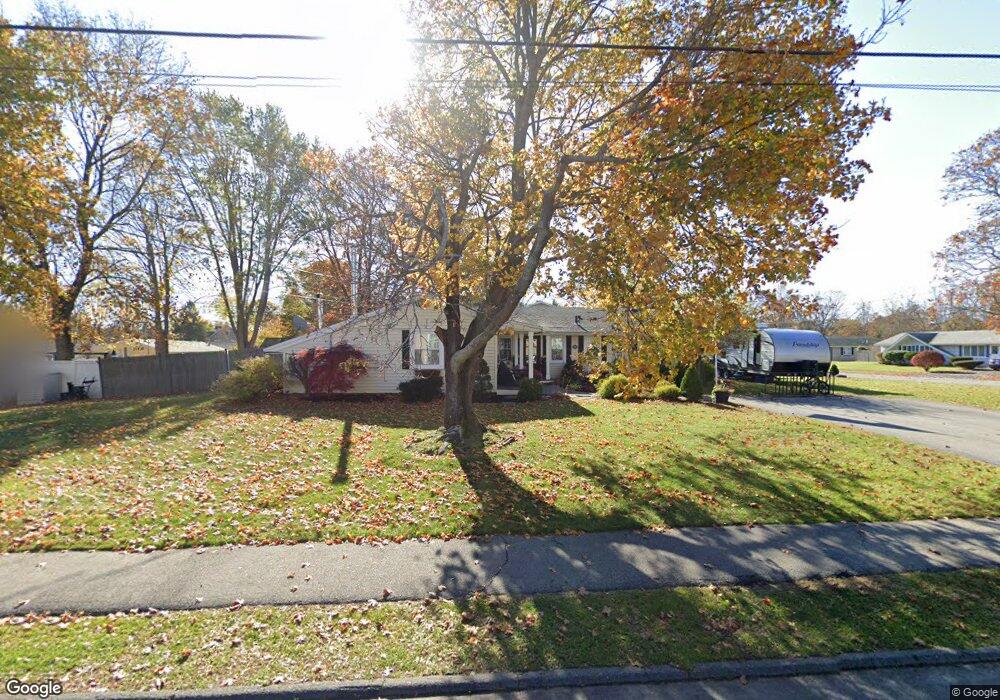
This home is located at 53 Cabot Rd, Danvers, MA 01923 and is currently estimated at $697,331, approximately $421 per square foot. 53 Cabot Rd is a home located in Essex County with nearby schools including Danvers High School, St. Mary of the Annunciation School, and St. John's Prep.
Ownership History
We collect this data history from publicly available records. To have your information removed, we recommend requesting removal directly through your county’s website.
Purchase Details
Purchase Details
Purchase Details
Home Values in the Area
Average Home Value in this Area
Purchase History
We collect this data history from publicly available records. To have your information removed, we recommend requesting removal directly through your county’s website.
| Date | Buyer | Sale Price | Title Company |
|---|---|---|---|
| $365,000 | -- | ||
| $187,500 | -- | ||
| $158,900 | -- |
Mortgage History
We collect this data history from publicly available records. To have your information removed, we recommend requesting removal directly through your county’s website.
| Date | Status | Borrower | Loan Amount |
|---|---|---|---|
| Open | $324,000 | ||
| Closed | $324,000 |
Tax History
We collect this data history from publicly available records. To have your information removed, we recommend requesting removal directly through your county’s website.
| Year | Tax Paid | Tax Assessment Tax Assessment Total Assessment is a certain percentage of the fair market value that is determined by local assessors to be the total taxable value of land and additions on the property. | Land | Improvement |
|---|---|---|---|---|
| 2025 | $6,559 | $596,800 | $376,400 | $220,400 |
| 2024 | $6,568 | $591,200 | $376,400 | $214,800 |
| 2023 | $6,287 | $535,100 | $342,100 | $193,000 |
| 2022 | $6,148 | $485,600 | $310,400 | $175,200 |
| 2021 | $5,891 | $441,300 | $294,000 | $147,300 |
| 2020 | $5,719 | $437,900 | $290,600 | $147,300 |
| 2019 | $5,463 | $411,400 | $264,100 | $147,300 |
| 2018 | $5,304 | $391,700 | $261,500 | $130,200 |
| 2017 | $5,063 | $356,800 | $228,500 | $128,300 |
| 2016 | $4,827 | $339,900 | $217,900 | $122,000 |
| 2015 | $4,595 | $308,200 | $198,100 | $110,100 |
Map
- 8 Riding Club Rd
- 9 Graystone Dr
- 12 Chestnut St
- 37 Princeton St
- 22 Burley St
- 14 Poplar St
- 18 Strawberry Hill Ln
- 17 Stafford Rd
- 103 Wenham St
- 12 Wildwood Rd
- 106 Conant St
- 115 Maple St
- 10 Cottage Ave
- 180 Conant Conant St
- 4 Pentucket Ln
- 16 Beaver Park
- 9 College Pond Dr
- 4 Alden St Unit 3
- 236 Maple St
- 41 Hobart St
Ask me questions while you tour the home.