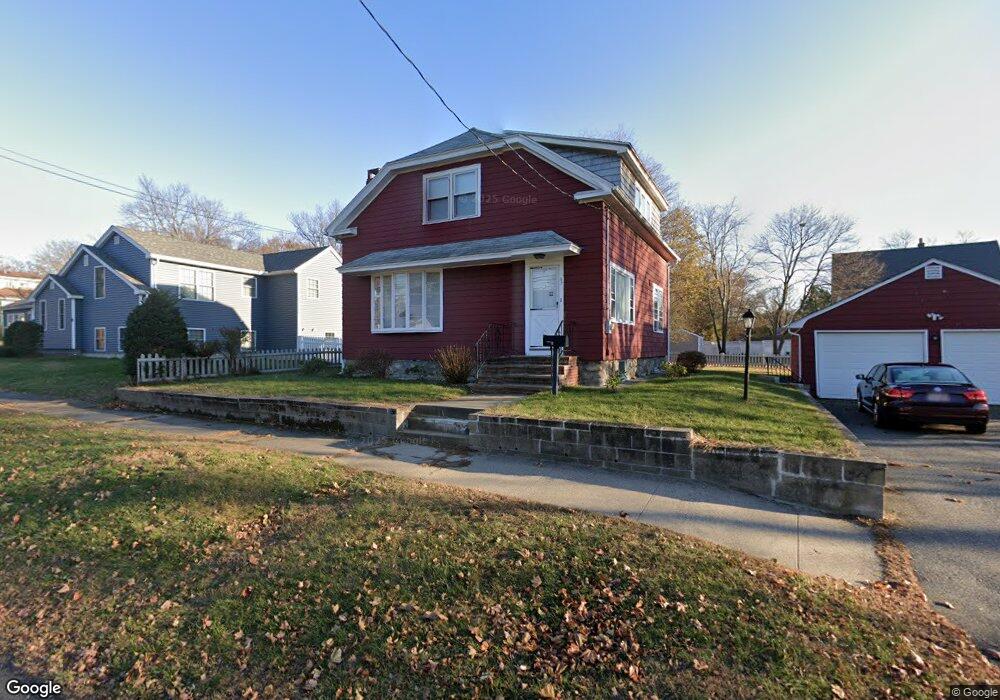
53 Chadwick St North Andover, MA 01845
Estimated Value: $507,000 - $643,000
2
Beds
2
Baths
1,425
Sq Ft
$416/Sq Ft
Est. Value
About This Home
This home is located at 53 Chadwick St, North Andover, MA 01845 and is currently estimated at $593,005, approximately $416 per square foot. 53 Chadwick St is a home located in Essex County with nearby schools including Thomson Elementary School, North Andover Middle School, and North Andover High School.
Ownership History
Date
Name
Owned For
Owner Type
Purchase Details
Closed on
Sep 29, 2009
Sold by
Endelos Stella A Est
Bought by
Finno Bernard and Finno Jodie A
Current Estimated Value
Home Financials for this Owner
Home Financials are based on the most recent Mortgage that was taken out on this home.
Original Mortgage
$199,507
Outstanding Balance
$131,796
Interest Rate
5.31%
Mortgage Type
Purchase Money Mortgage
Estimated Equity
$461,209
Create a Home Valuation Report for This Property
The Home Valuation Report is an in-depth analysis detailing your home's value as well as a comparison with similar homes in the area
Home Values in the Area
Average Home Value in this Area
Purchase History
| Date | Buyer | Sale Price | Title Company |
|---|---|---|---|
| Finno Bernard | $259,100 | -- |
Source: Public Records
Mortgage History
| Date | Status | Borrower | Loan Amount |
|---|---|---|---|
| Open | Finno Bernard | $199,507 |
Source: Public Records
Tax History
| Year | Tax Paid | Tax Assessment Tax Assessment Total Assessment is a certain percentage of the fair market value that is determined by local assessors to be the total taxable value of land and additions on the property. | Land | Improvement |
|---|---|---|---|---|
| 2025 | $5,872 | $521,500 | $300,100 | $221,400 |
| 2024 | $5,522 | $497,900 | $282,400 | $215,500 |
| 2023 | $5,432 | $443,800 | $259,500 | $184,300 |
| 2022 | $5,374 | $397,200 | $233,000 | $164,200 |
| 2021 | $5,154 | $363,700 | $211,800 | $151,900 |
| 2020 | $4,997 | $363,700 | $211,800 | $151,900 |
| 2019 | $4,966 | $370,300 | $211,800 | $158,500 |
| 2018 | $5,380 | $370,300 | $211,800 | $158,500 |
| 2017 | $4,697 | $328,900 | $175,200 | $153,700 |
| 2016 | $4,688 | $328,500 | $171,800 | $156,700 |
| 2015 | $4,316 | $299,900 | $165,900 | $134,000 |
Source: Public Records
Map
Nearby Homes
- 118 Prescott St
- 148 Main St Unit F442
- 94 Main St
- 0 Great Pond Rd
- 86 Maple Ave Unit 88
- 37 Lincoln St Unit 39
- 27 Woodland Ct
- 219 Waverley Rd
- 2 Cherry St
- 100 Union St
- 76 Allston St
- 41 Lyman Rd
- 52 Howard St
- 1785 Great Pond Rd
- 7 Stevens Ct
- 12 Mill Pond Unit 12
- 27 Mill Pond
- 1 Riverview Blvd Unit 8-203
- 1 Riverview Blvd Unit 1:209
- 1 Riverview Blvd Unit 4-203
- 69 Highland View Ave
- 69 Highland View Ave Unit 1
- 61 Chadwick St
- 41 Chadwick St
- 74 Wentworth Ave
- 74 Wentworth Ave Unit 74
- 72 Wentworth Ave
- 74R Wentworth Ave Unit 74
- 46 Chadwick St
- 63 Highland View Ave
- 56 Chadwick St
- 35 Chadwick St
- 66 Wentworth Ave
- 68 Highland View Ave
- 69 Brightwood Ave
- 69 Brightwood Ave Unit 71
- 71 Chadwick St Unit 73
- 71 Chadwick St Unit 2
- 49 Highland View Ave
- 73 Wentworth Ave
Your Personal Tour Guide
Ask me questions while you tour the home.