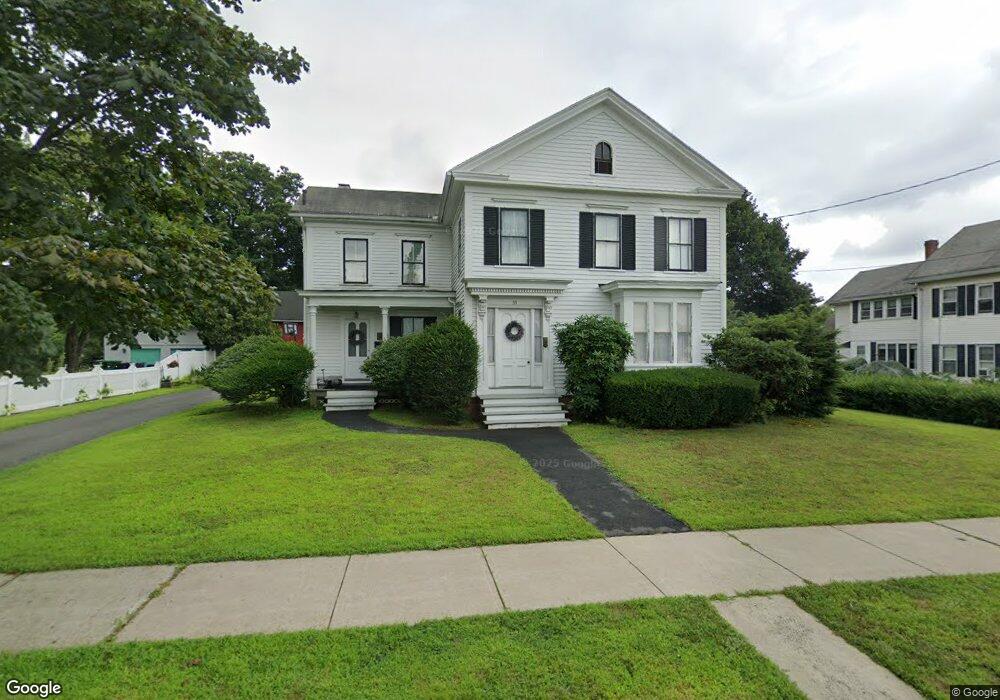
53 Chapin St Chicopee, MA 01013
Chicopee Center NeighborhoodEstimated Value: $330,785 - $429,000
About This Home
This home is located at 53 Chapin St, Chicopee, MA 01013 and is currently estimated at $392,696, approximately $153 per square foot. 53 Chapin St is a home located in Hampden County with nearby schools including Bowe Elementary School, Fairview Middle School, and Chicopee High School.
Ownership History
We collect this data history from publicly available records. To have your information removed, we recommend requesting removal directly through your county’s website.
Purchase Details
Home Financials for this Owner
Home Financials are based on the most recent Mortgage that was taken out on this home.Home Values in the Area
Average Home Value in this Area
Purchase History
We collect this data history from publicly available records. To have your information removed, we recommend requesting removal directly through your county’s website.
| Date | Buyer | Sale Price | Title Company |
|---|---|---|---|
| $62,000 | -- |
Mortgage History
We collect this data history from publicly available records. To have your information removed, we recommend requesting removal directly through your county’s website.
| Date | Status | Borrower | Loan Amount |
|---|---|---|---|
| Open | $24,000 | ||
| Closed | $22,383 | ||
| Closed | $62,000 |
Tax History
We collect this data history from publicly available records. To have your information removed, we recommend requesting removal directly through your county’s website.
| Year | Tax Paid | Tax Assessment Tax Assessment Total Assessment is a certain percentage of the fair market value that is determined by local assessors to be the total taxable value of land and additions on the property. | Land | Improvement |
|---|---|---|---|---|
| 2025 | $4,556 | $300,500 | $72,100 | $228,400 |
| 2024 | $4,307 | $291,800 | $70,600 | $221,200 |
| 2023 | $4,022 | $265,500 | $64,200 | $201,300 |
| 2022 | $3,938 | $231,800 | $55,900 | $175,900 |
| 2021 | $3,737 | $212,200 | $50,800 | $161,400 |
| 2020 | $3,515 | $201,300 | $50,800 | $150,500 |
| 2019 | $3,411 | $189,900 | $50,800 | $139,100 |
| 2018 | $3,334 | $182,100 | $48,400 | $133,700 |
| 2017 | $3,187 | $184,100 | $51,500 | $132,600 |
| 2016 | $2,961 | $175,100 | $51,500 | $123,600 |
| 2015 | $2,947 | $168,000 | $51,500 | $116,500 |
| 2014 | $1,473 | $168,000 | $51,500 | $116,500 |
Map
- 250 School St
- 156 South St
- 2 Marion St
- 40 Marion
- 0 School St
- 177 Marion St
- 44 White St
- 35 Lower Grape St
- 78 Marble Ave
- 115 Bonneville Ave
- 85 Farnsworth St
- 20 Athol St
- 73 Gardner Rd
- 18 Los Angeles St
- 115 Connecticut Ave
- 130 Connecticut Ave
- 75 Wheatland Ave
- 827-831 Armory St
- 265 Wheatland Ave
- 582 Broadway St
- 25 Captain Mac St
- 37 Captain Mac St
- 30 Captain Mac St
- 43 Chapin St
- 33 Chapin St
- 28 Stearns Terrace
- 45 Captain Mac St
- 20 Captain Mac St
- 23 Chapin St
- 24 Stearns Terrace
- 26 Stearns Terrace
- 24 Stearns Terrace Unit 1
- 14 Captain Mac St
- 20 Stearns Terrace
- 6 Captain Mac St
- 51 Captain Mac St
- 6 Captain Mac St
- 139 Nonotuck Ave
- 139 Nonotuck Ave Unit 2
- 145 Nonotuck Ave
Ask me questions while you tour the home.