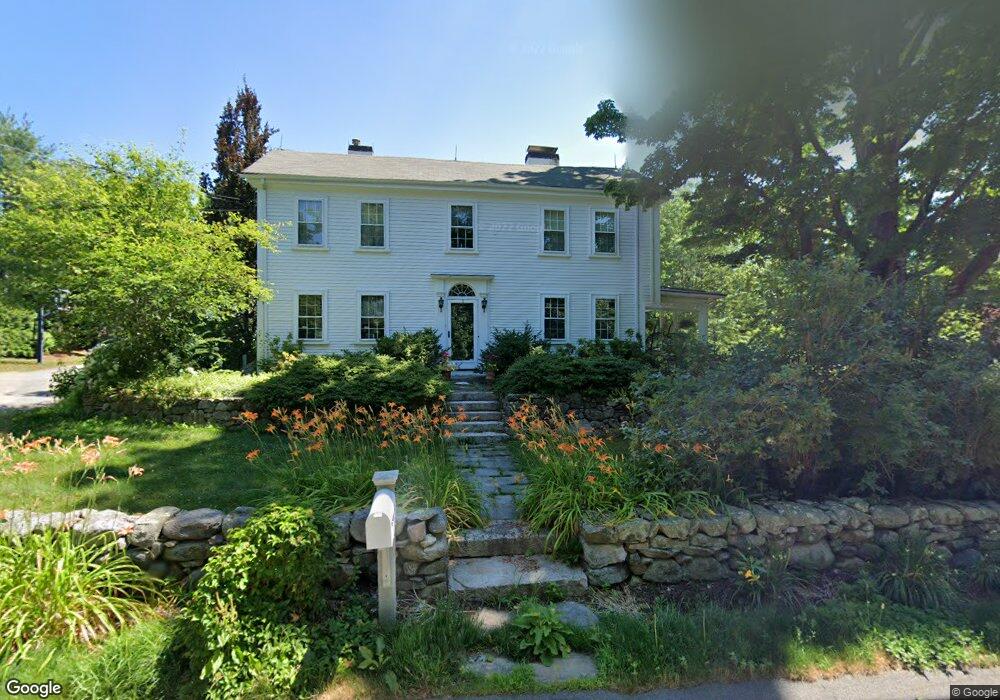
53 Farm St Medfield, MA 02052
Estimated Value: $1,374,892 - $1,743,000
5
Beds
5
Baths
3,755
Sq Ft
$407/Sq Ft
Est. Value
About This Home
This home is located at 53 Farm St, Medfield, MA 02052 and is currently estimated at $1,526,473, approximately $406 per square foot. 53 Farm St is a home located in Norfolk County with nearby schools including Memorial School, Ralph Wheelock School, and Dale Street School.
Ownership History
Date
Name
Owned For
Owner Type
Purchase Details
Closed on
Aug 19, 1997
Sold by
Rheault Donald C and Rheault Susan K
Bought by
Woolley Peter S and Woolley Kimberly R
Current Estimated Value
Create a Home Valuation Report for This Property
The Home Valuation Report is an in-depth analysis detailing your home's value as well as a comparison with similar homes in the area
Home Values in the Area
Average Home Value in this Area
Purchase History
We collect this data history from publicly available records. To have your information removed, we recommend requesting removal directly through your county’s website.
| Date | Buyer | Sale Price | Title Company |
|---|---|---|---|
| Woolley Peter S | $415,000 | -- | |
| Woolley Peter S | $415,000 | -- |
Source: Public Records
Mortgage History
We collect this data history from publicly available records. To have your information removed, we recommend requesting removal directly through your county’s website.
| Date | Status | Borrower | Loan Amount |
|---|---|---|---|
| Open | Woolley Peter S | $417,000 | |
| Closed | Woolley Peter S | $417,000 |
Source: Public Records
Tax History
| Year | Tax Paid | Tax Assessment Tax Assessment Total Assessment is a certain percentage of the fair market value that is determined by local assessors to be the total taxable value of land and additions on the property. | Land | Improvement |
|---|---|---|---|---|
| 2025 | $14,567 | $1,055,600 | $486,800 | $568,800 |
| 2024 | $14,475 | $988,700 | $441,600 | $547,100 |
| 2023 | $14,449 | $936,400 | $421,600 | $514,800 |
| 2022 | $13,682 | $785,400 | $401,600 | $383,800 |
| 2021 | $13,411 | $755,100 | $391,600 | $363,500 |
| 2020 | $13,075 | $733,300 | $387,600 | $345,700 |
| 2019 | $12,977 | $726,200 | $381,600 | $344,600 |
| 2018 | $12,103 | $710,700 | $369,600 | $341,100 |
| 2017 | $11,733 | $694,700 | $353,600 | $341,100 |
| 2016 | $11,030 | $658,500 | $343,600 | $314,900 |
| 2015 | $11,071 | $690,200 | $392,700 | $297,500 |
| 2014 | $10,752 | $667,000 | $369,500 | $297,500 |
Source: Public Records
Map
Nearby Homes
- 123 Harding St
- 67 Blacksmith Dr
- 40 Grand Hill Dr
- 5 Stoneridge Way Unit 5
- 3 Shining Valley Cir
- 60 Harding St Unit C
- 23 Winter St
- 18 Emerson Rd
- 92 North St
- 4 Lincoln Ct
- 2 Lincoln Ct
- 12 Greystone Rd
- 9 Bridge St
- 22 South St
- 5 Spring St Unit A
- 6 Hearthstone Dr
- 00000 S Main St and Bullard St
- 50 Yorkshire Rd
- 26 Valley Rd
- 36 Yorkshire Rd
Your Personal Tour Guide
Ask me questions while you tour the home.