53 Flint St Trumbull, CT 06611
Long Hill AreaEstimated Value: $684,000 - $710,000
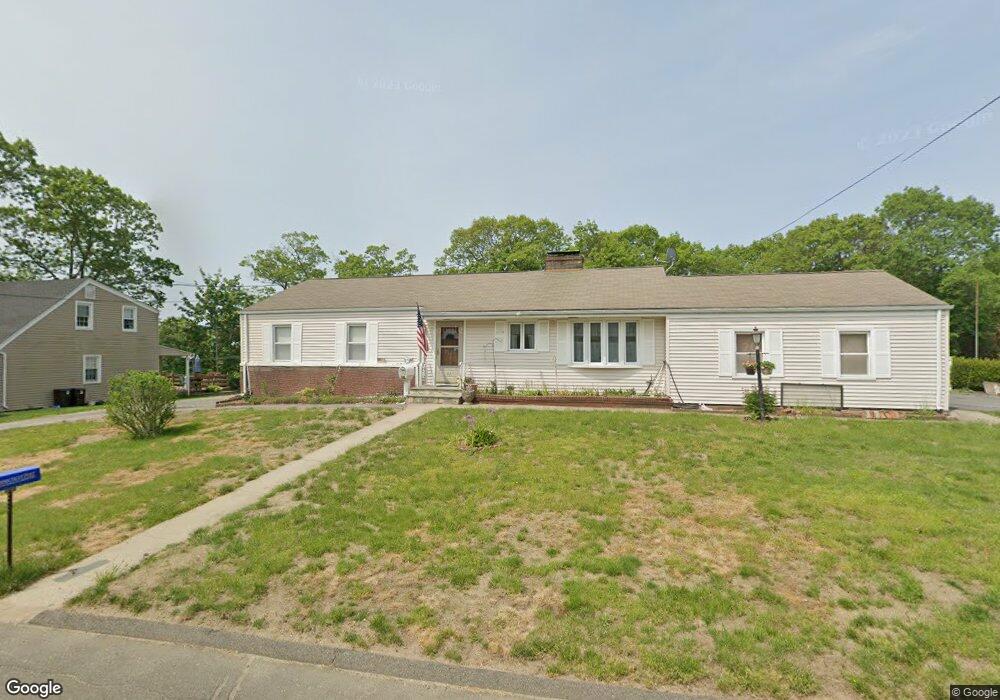
About This Home
This home is located at 53 Flint St, Trumbull, CT 06611 and is currently estimated at $693,674, approximately $330 per square foot. 53 Flint St is a home located in Fairfield County with nearby schools including Middlebrook School, Madison Middle School, and Trumbull High School.
Ownership History
We collect this data history from publicly available records. To have your information removed, we recommend requesting removal directly through your county’s website.
Purchase Details
Purchase Details
Home Values in the Area
Average Home Value in this Area
Purchase History
We collect this data history from publicly available records. To have your information removed, we recommend requesting removal directly through your county’s website.
| Date | Buyer | Sale Price | Title Company |
|---|---|---|---|
| $137,500 | -- | ||
| $215,000 | -- |
Mortgage History
We collect this data history from publicly available records. To have your information removed, we recommend requesting removal directly through your county’s website.
| Date | Status | Borrower | Loan Amount |
|---|---|---|---|
| Open | $115,000 |
Tax History
We collect this data history from publicly available records. To have your information removed, we recommend requesting removal directly through your county’s website.
| Year | Tax Paid | Tax Assessment Tax Assessment Total Assessment is a certain percentage of the fair market value that is determined by local assessors to be the total taxable value of land and additions on the property. | Land | Improvement |
|---|---|---|---|---|
| 2025 | $11,238 | $305,830 | $150,080 | $155,750 |
| 2024 | $10,920 | $305,830 | $150,080 | $155,750 |
| 2023 | $10,746 | $305,830 | $150,080 | $155,750 |
| 2022 | $10,573 | $305,830 | $150,080 | $155,750 |
| 2021 | $9,036 | $248,500 | $125,020 | $123,480 |
| 2020 | $8,863 | $248,500 | $125,020 | $123,480 |
| 2018 | $8,664 | $248,500 | $125,020 | $123,480 |
| 2017 | $8,504 | $248,500 | $125,020 | $123,480 |
| 2016 | $8,285 | $248,500 | $125,020 | $123,480 |
| 2015 | $8,364 | $249,900 | $125,000 | $124,900 |
| 2014 | $8,187 | $249,900 | $125,000 | $124,900 |
Map
- 24 Crown St
- 359 Hadley Dr
- 135 Mayfield Dr
- 253 Mayfield Dr Unit 253
- 187 Mayfield Dr
- 15 Evelyn St
- 40 Rose Terrace
- 26 Westwood Rd
- 163 Fernwood Rd
- 17 Woodlawn Dr
- 109 Sterling Rd
- 16 Floral Ln
- 85 Canterbury Ln
- 10 Paulina Place
- 124 Elliott Rd
- 46 Gibson Ave
- 48 Linley Rd
- 14 Peters Rd
- 46 Sherman Ave
- 45 Glenbrook Rd
Ask me questions while you tour the home.