
Seller's Agent in 2023
Carrie Ford
Better Homes and Gardens Real Estate Foothills
(828) 302-1905
40 Total Sales


Estimated Value: $366,000 - $451,188
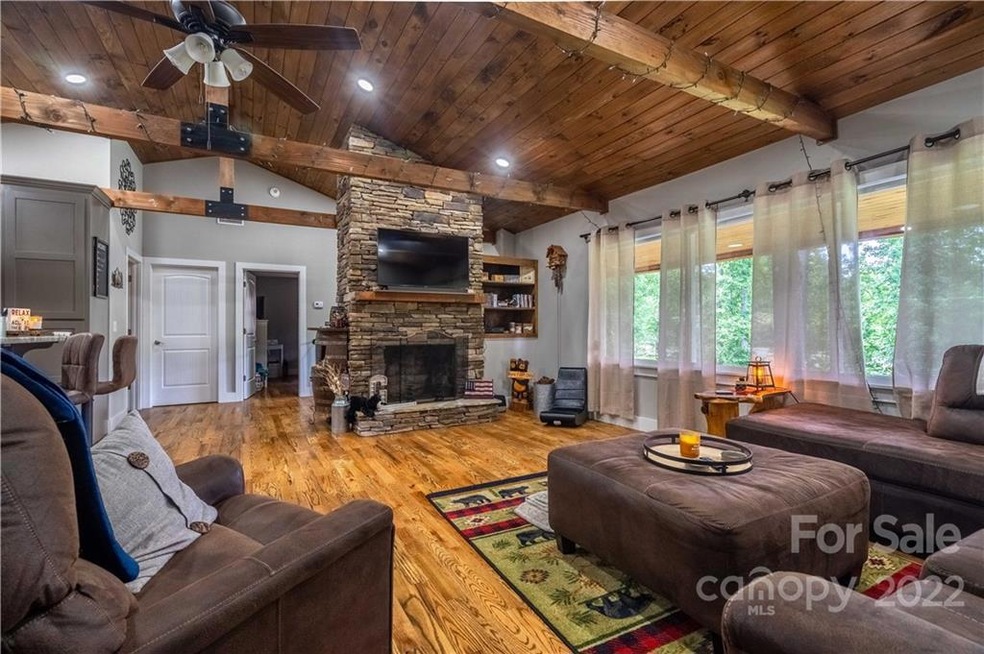
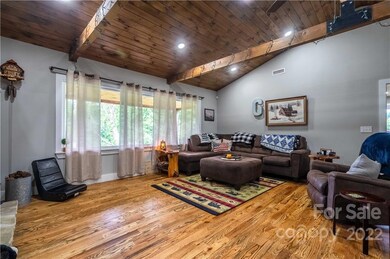
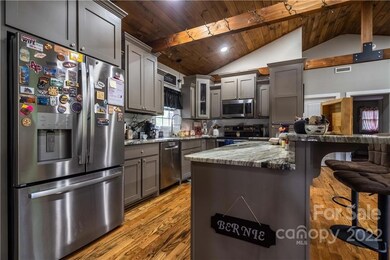
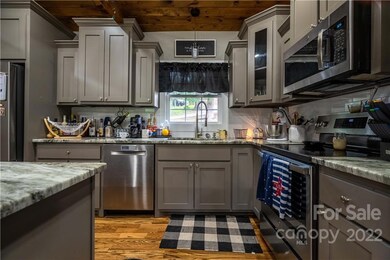
LEASE PURCHASE OPTION AVAILABLE! 4 BR/3BA Craftsman style home. Completely renovated top to bottom & ready for you to move right in! The main level offers an open floor plan, 3 bedrooms, 2 baths, hardwood floors & custom cabinetry. Beautiful kitchen w/ island, granite counters & SS appliances. Cozy living room with tongue and groove beam ceiling, large stone wood-burning fireplace. The primary suite hosts large walk-in closet w/oversized drawer cabinetry & shelving, barn doors, office/nursery room & screened-in porch area. En suite includes custom tile shower, soaking tub & dual vanity w/ granite countertops. Daylight basement offers family room/game room with kitchen, 4th bedroom, full bath w/tile shower, office/craft room, laundry room, under deck parking w/no step entry into home. Basement is 1294 sq ft & heated & cooled but has a ceiling height of slightly under 7 feet. Detached double garage w/ workshop. Lots of outdoor areas for relaxing or entertaining. Roof & HVAC 2 yrs old.
Last Agent to Sell the Property
Better Homes and Gardens Real Estate Foothills Brokerage Email: Carrie.Ford@BetterFoothills.com License #240168 Listed on: 07/10/2022
We collect this data history from publicly available records. To have your information removed, we recommend requesting removal directly through your county’s website.
We collect this data history from publicly available records. To have your information removed, we recommend requesting removal directly through your county’s website.
| Date | Buyer | Sale Price | Title Company |
|---|---|---|---|
| $390,000 | None Listed On Document | ||
| $358,000 | None Available | ||
| -- | -- | ||
| -- | -- | ||
| $80,688 | -- | ||
| $89,000 | None Available | ||
| $65,000 | -- | ||
| $94,500 | -- |
We collect this data history from publicly available records. To have your information removed, we recommend requesting removal directly through your county’s website.
| Date | Status | Borrower | Loan Amount |
|---|---|---|---|
| Open | $382,936 | ||
| Previous Owner | $370,888 | ||
| Previous Owner | $89,000 |
We collect this data history from publicly available records. To have your information removed, we recommend requesting removal directly through your county’s website.
| Date | Event | Price | List to Sale | Price per Sq Ft | Prior Sale |
|---|---|---|---|---|---|
| 03/10/2023 03/10/23 | Sold | $390,000 | 0.0% | $130 / Sq Ft | |
| 08/25/2022 08/25/22 | Price Changed | $389,900 | -2.5% | $130 / Sq Ft | |
| 08/25/2022 08/25/22 | For Sale | $399,900 | 0.0% | $133 / Sq Ft | |
| 07/27/2022 07/27/22 | Pending | -- | -- | -- | |
| 07/10/2022 07/10/22 | For Sale | $399,900 | +11.7% | $133 / Sq Ft | |
| 07/12/2021 07/12/21 | Sold | $358,000 | +2.6% | $106 / Sq Ft | View Prior Sale |
| 06/04/2021 06/04/21 | Pending | -- | -- | -- | |
| 05/26/2021 05/26/21 | Price Changed | $349,000 | 0.0% | $104 / Sq Ft | |
| 05/26/2021 05/26/21 | For Sale | $349,000 | +1.2% | $104 / Sq Ft | |
| 05/16/2021 05/16/21 | Pending | -- | -- | -- | |
| 04/26/2021 04/26/21 | For Sale | $345,000 | +820.0% | $102 / Sq Ft | |
| 05/03/2019 05/03/19 | Sold | $37,500 | -16.7% | $22 / Sq Ft | View Prior Sale |
| 04/03/2019 04/03/19 | Pending | -- | -- | -- | |
| 03/13/2019 03/13/19 | Price Changed | $45,000 | -10.0% | $26 / Sq Ft | |
| 02/19/2019 02/19/19 | Price Changed | $50,000 | -9.1% | $29 / Sq Ft | |
| 02/13/2019 02/13/19 | For Sale | $55,000 | -38.2% | $32 / Sq Ft | |
| 04/19/2017 04/19/17 | Sold | $89,000 | -25.8% | $37 / Sq Ft | View Prior Sale |
| 03/20/2017 03/20/17 | Pending | -- | -- | -- | |
| 09/11/2015 09/11/15 | For Sale | $120,000 | -- | $50 / Sq Ft |
We collect this data history from publicly available records. To have your information removed, we recommend requesting removal directly through your county’s website.
| Year | Tax Paid | Tax Assessment Tax Assessment Total Assessment is a certain percentage of the fair market value that is determined by local assessors to be the total taxable value of land and additions on the property. | Land | Improvement |
|---|---|---|---|---|
| 2025 | $2,412 | $380,000 | $25,200 | $354,800 |
| 2024 | $10 | $149,200 | $25,200 | $124,000 |
| 2023 | $958 | $149,200 | $25,200 | $124,000 |
| 2022 | $939 | $149,200 | $25,200 | $124,000 |
| 2021 | $939 | $149,200 | $25,200 | $124,000 |
| 2020 | $1,162 | $181,600 | $72,000 | $109,600 |
| 2019 | $847 | $134,400 | $72,000 | $62,400 |
| 2018 | $1,467 | $134,400 | $0 | $0 |
| 2017 | $1,467 | $134,400 | $0 | $0 |
| 2016 | $876 | $134,400 | $0 | $0 |
| 2015 | $831 | $134,400 | $0 | $0 |
| 2014 | $831 | $134,400 | $0 | $0 |
Seller's Agent in 2023
Carrie Ford
Better Homes and Gardens Real Estate Foothills
(828) 302-1905
40 Total Sales
Buyer's Agent in 2023
Marty Pennell
Weichert, Realtors - Team Metro
(828) 446-6696
243 Total Sales
E
Seller's Agent in 2021
Eric Jenkins
Table Rock Realty, LLC
(828) 850-5858
12 Total Sales
Seller's Agent in 2019
Timothy Truitt
WNC Real Estate Inc.
(828) 443-6345
26 Total Sales
Seller's Agent in 2017
Cory Klassett
RE/MAX
(828) 446-4589
94 Total Sales
D
Buyer's Agent in 2017
David Greer
Granite Falls Realty LLC
Source: Canopy MLS
MLS Number: 3882061
APN: 08-16-1-12
Disclaimer: Certain information contained herein is derived from information provided by parties other than Homes.com. All information provided is deemed reliable, but is not guaranteed to be accurate and should be independently verified.
![]() All data is obtained from various sources and may not have been verified by broker or MLS GRID. Supplied Open House Information is subject to change without notice. All information should be independently reviewed and verified for accuracy. Properties may or may not be listed by the office/agent presenting the information. Some IDX listings have been excluded from this website.
All data is obtained from various sources and may not have been verified by broker or MLS GRID. Supplied Open House Information is subject to change without notice. All information should be independently reviewed and verified for accuracy. Properties may or may not be listed by the office/agent presenting the information. Some IDX listings have been excluded from this website.
Based on information submitted to the MLS GRID
Listings courtesy of Canopy MLS as distributed by MLS GRID
Ask me questions while you tour the home.