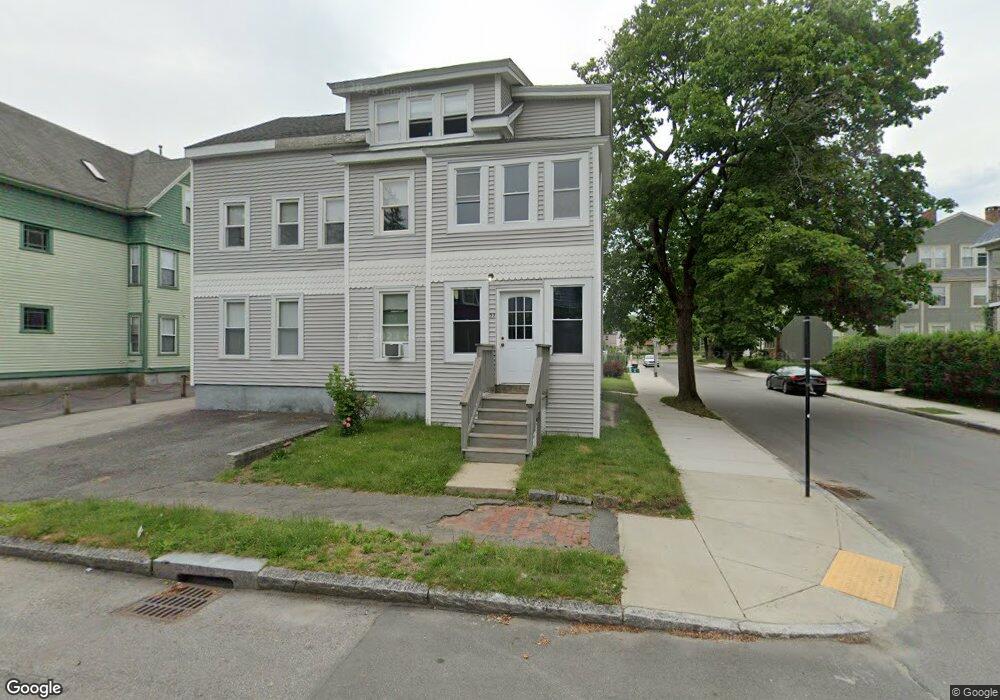
53 Fruit St Worcester, MA 01609
Elm Park NeighborhoodEstimated Value: $684,000 - $740,000
9
Beds
3
Baths
3,327
Sq Ft
$214/Sq Ft
Est. Value
About This Home
This home is located at 53 Fruit St, Worcester, MA 01609 and is currently estimated at $712,333, approximately $214 per square foot. 53 Fruit St is a home located in Worcester County with nearby schools including Jacob Hiatt Magnet School, Chandler Magnet, and Elm Park Elementary School.
Ownership History
Date
Name
Owned For
Owner Type
Purchase Details
Closed on
Sep 22, 2020
Sold by
Worcester Highland Rlty
Bought by
Rotti Joseph W
Current Estimated Value
Home Financials for this Owner
Home Financials are based on the most recent Mortgage that was taken out on this home.
Original Mortgage
$278,506
Outstanding Balance
$244,414
Interest Rate
2.8%
Mortgage Type
New Conventional
Estimated Equity
$467,919
Purchase Details
Closed on
Jan 23, 2020
Sold by
50 Franklin Street Lp
Bought by
Worcester Highland Realty
Purchase Details
Closed on
Sep 7, 2017
Sold by
Mullaney Mark S
Bought by
50 Franklin Street Lp
Purchase Details
Closed on
Dec 30, 1993
Sold by
Hibernia S B
Bought by
Mullaney Mark S
Home Financials for this Owner
Home Financials are based on the most recent Mortgage that was taken out on this home.
Original Mortgage
$36,900
Interest Rate
7%
Mortgage Type
Purchase Money Mortgage
Purchase Details
Closed on
Sep 24, 1993
Sold by
Jubinville Jon F and Hibernia Sb
Bought by
Hibernia Sb
Create a Home Valuation Report for This Property
The Home Valuation Report is an in-depth analysis detailing your home's value as well as a comparison with similar homes in the area
Home Values in the Area
Average Home Value in this Area
Purchase History
| Date | Buyer | Sale Price | Title Company |
|---|---|---|---|
| Rotti Joseph W | $1,641,794 | Misc Company | |
| Worcester Highland Realty | -- | None Available | |
| 50 Franklin Street Lp | $682,500 | -- | |
| Mullaney Mark S | $41,000 | -- | |
| Hibernia Sb | $50,000 | -- |
Source: Public Records
Mortgage History
| Date | Status | Borrower | Loan Amount |
|---|---|---|---|
| Open | Rotti Joseph W | $278,506 | |
| Previous Owner | Hibernia Sb | $40,000 | |
| Previous Owner | Hibernia Sb | $36,900 | |
| Previous Owner | Hibernia Sb | $100,000 |
Source: Public Records
Tax History
| Year | Tax Paid | Tax Assessment Tax Assessment Total Assessment is a certain percentage of the fair market value that is determined by local assessors to be the total taxable value of land and additions on the property. | Land | Improvement |
|---|---|---|---|---|
| 2025 | $7,678 | $582,100 | $69,900 | $512,200 |
| 2024 | $7,454 | $542,100 | $69,900 | $472,200 |
| 2023 | $6,908 | $481,700 | $60,800 | $420,900 |
| 2022 | $6,228 | $409,500 | $48,600 | $360,900 |
| 2021 | $5,035 | $309,300 | $38,900 | $270,400 |
| 2020 | $4,323 | $254,300 | $38,600 | $215,700 |
| 2019 | $4,491 | $249,500 | $33,800 | $215,700 |
| 2018 | $4,550 | $240,600 | $33,800 | $206,800 |
| 2017 | $4,292 | $223,300 | $33,800 | $189,500 |
| 2016 | $4,233 | $205,400 | $24,900 | $180,500 |
| 2015 | $4,122 | $205,400 | $24,900 | $180,500 |
| 2014 | $4,014 | $205,400 | $24,900 | $180,500 |
Source: Public Records
Map
Nearby Homes
- 3 Marston Way
- 13 Hampden St
- 60 Fruit St
- 38 1/2 Bowdoin St
- 10 Trowbridge Rd
- 89 William St
- 29 William St Unit 22
- 9 Dover St
- 172 Russell St
- 56 Elm St Unit 2
- 6 Pelham St
- 13 West St
- 8 Pelham St
- 20 Ashland St Unit 3L
- 15 Goulding St
- 59 Dover St
- 14 Ashland St Unit 2R
- 31 Chestnut St Unit 5
- 34 Elm St
- 26 Lee St
Your Personal Tour Guide
Ask me questions while you tour the home.