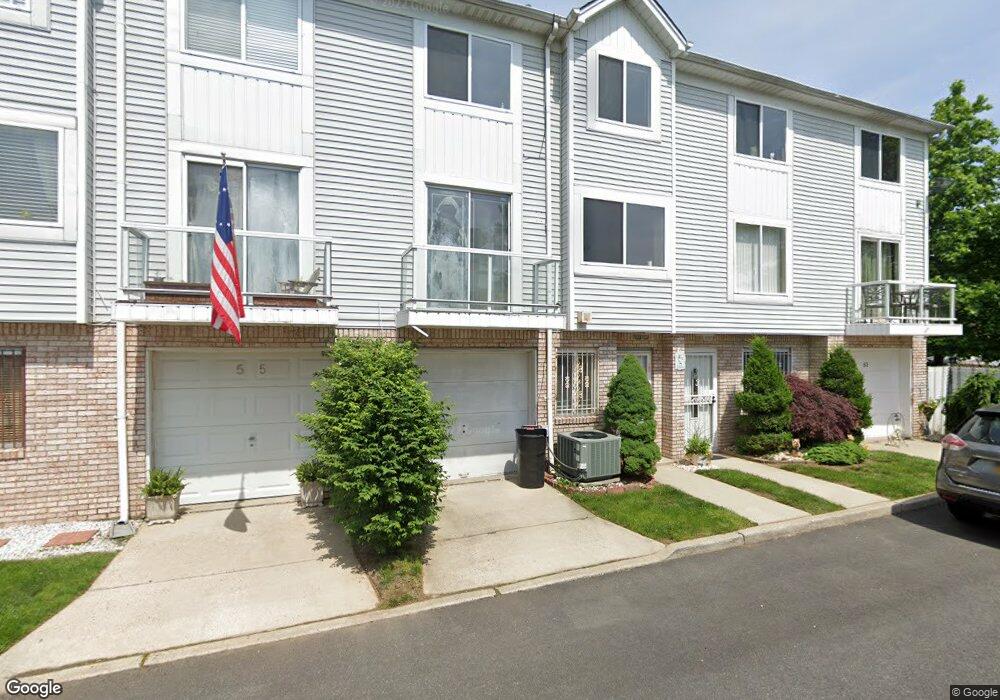
53 Hart Loop Staten Island, NY 10306
Great Kills NeighborhoodEstimated Value: $509,000 - $597,000
2
Beds
2
Baths
1,150
Sq Ft
$475/Sq Ft
Est. Value
About This Home
This home is located at 53 Hart Loop, Staten Island, NY 10306 and is currently estimated at $545,712, approximately $474 per square foot. 53 Hart Loop is a home located in Richmond County with nearby schools including P.S. 50 Frank Hankinson School, Myra S. Barnes Intermediate School 24, and Susan E Wagner High School.
Ownership History
Date
Name
Owned For
Owner Type
Purchase Details
Closed on
Jun 16, 2006
Sold by
Bitar Pierre M
Bought by
Fallous Ghassan
Current Estimated Value
Home Financials for this Owner
Home Financials are based on the most recent Mortgage that was taken out on this home.
Original Mortgage
$324,800
Outstanding Balance
$188,085
Interest Rate
6.59%
Mortgage Type
Purchase Money Mortgage
Estimated Equity
$357,627
Purchase Details
Closed on
May 2, 2001
Sold by
Weiss Josephine
Bought by
Bitar Pierre M
Home Financials for this Owner
Home Financials are based on the most recent Mortgage that was taken out on this home.
Original Mortgage
$177,913
Interest Rate
7.03%
Purchase Details
Closed on
Jul 28, 1995
Sold by
Weiss Bruce and Lattuga Josephine
Bought by
Weiss Josephine
Create a Home Valuation Report for This Property
The Home Valuation Report is an in-depth analysis detailing your home's value as well as a comparison with similar homes in the area
Home Values in the Area
Average Home Value in this Area
Purchase History
| Date | Buyer | Sale Price | Title Company |
|---|---|---|---|
| Fallous Ghassan | $341,900 | None Available | |
| Bitar Pierre M | $195,000 | -- | |
| Weiss Josephine | -- | -- |
Source: Public Records
Mortgage History
| Date | Status | Borrower | Loan Amount |
|---|---|---|---|
| Open | Fallous Ghassan | $324,800 | |
| Previous Owner | Bitar Pierre M | $177,913 |
Source: Public Records
Tax History
| Year | Tax Paid | Tax Assessment Tax Assessment Total Assessment is a certain percentage of the fair market value that is determined by local assessors to be the total taxable value of land and additions on the property. | Land | Improvement |
|---|---|---|---|---|
| 2025 | $4,286 | $27,780 | $7,573 | $20,207 |
| 2024 | $4,286 | $28,860 | $6,877 | $21,983 |
| 2023 | $4,334 | $21,341 | $6,461 | $14,880 |
| 2022 | $4,228 | $26,100 | $9,300 | $16,800 |
| 2021 | $4,205 | $24,780 | $9,300 | $15,480 |
| 2020 | $3,990 | $22,860 | $9,300 | $13,560 |
| 2019 | $3,720 | $22,080 | $9,300 | $12,780 |
| 2018 | $3,625 | $17,784 | $7,898 | $9,886 |
| 2017 | $3,598 | $17,650 | $8,712 | $8,938 |
| 2016 | $3,329 | $16,651 | $8,632 | $8,019 |
| 2015 | $2,844 | $15,709 | $9,128 | $6,581 |
| 2014 | $2,844 | $14,820 | $10,320 | $4,500 |
Source: Public Records
Map
Nearby Homes
- 27 Croft Ct
- 25 Fuller Ct Unit A
- 15 Corona Ave
- 71 Luke Ct
- 33 Boyce Ave
- 43 Cherrywood Ct
- 80 Willowwood Ln
- 14 Montreal Ave
- 29 Ashwood Ct
- 36 Ashwood Ct
- 11 Ironwood St
- 52 Sandalwood Dr
- 3430 Amboy Rd Unit A
- 281 Thomas St
- 236 Amber St
- 43 Country Woods Ln
- 274 Barbara St
- 45 Woodcutters Ln
- 223 Amber St
- 265 Barbara St Unit 275
Your Personal Tour Guide
Ask me questions while you tour the home.