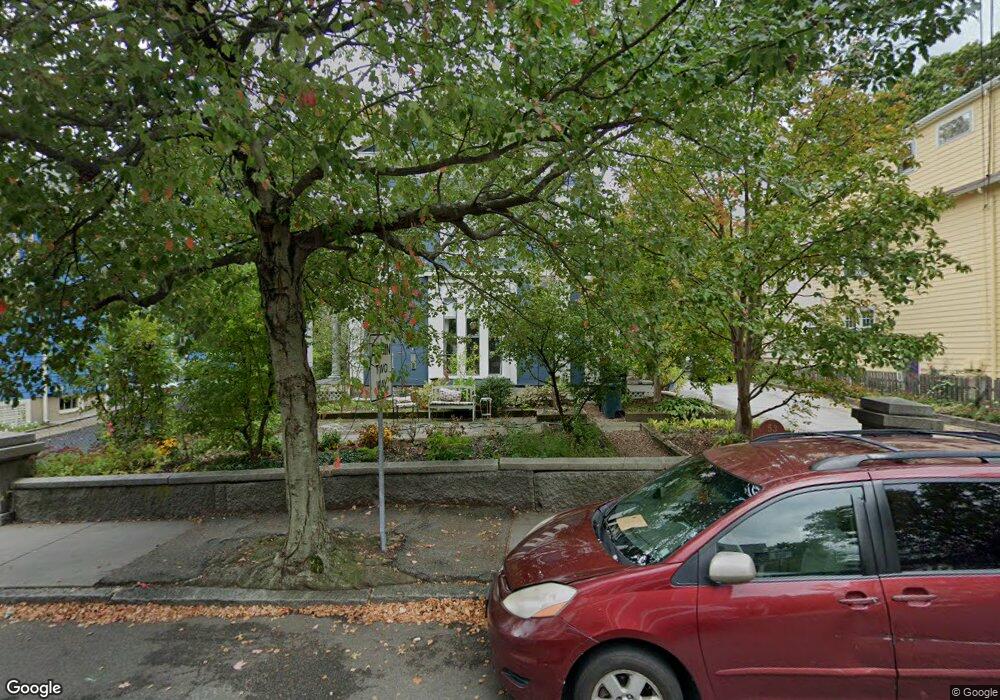
53 Linden St Brookline, MA 02445
Brookline Village NeighborhoodEstimated Value: $2,301,000 - $3,371,440
7
Beds
4
Baths
4,666
Sq Ft
$596/Sq Ft
Est. Value
About This Home
This home is located at 53 Linden St, Brookline, MA 02445 and is currently estimated at $2,779,860, approximately $595 per square foot. 53 Linden St is a home located in Norfolk County with nearby schools including Pierce School, Brookline High School, and St. Mary of the Assumption Elementary School.
Ownership History
Date
Name
Owned For
Owner Type
Purchase Details
Closed on
May 1, 2007
Sold by
Lowenstein Alice E
Bought by
Grace James F and Grace Lisa G
Current Estimated Value
Purchase Details
Closed on
Sep 6, 1989
Sold by
Bauer-Scott Grenele
Bought by
Lowenstein Alice E
Create a Home Valuation Report for This Property
The Home Valuation Report is an in-depth analysis detailing your home's value as well as a comparison with similar homes in the area
Home Values in the Area
Average Home Value in this Area
Purchase History
We collect this data history from publicly available records. To have your information removed, we recommend requesting removal directly through your county’s website.
| Date | Buyer | Sale Price | Title Company |
|---|---|---|---|
| Grace James F | $1,307,500 | -- | |
| Lowenstein Alice E | $550,000 | -- |
Source: Public Records
Mortgage History
We collect this data history from publicly available records. To have your information removed, we recommend requesting removal directly through your county’s website.
| Date | Status | Borrower | Loan Amount |
|---|---|---|---|
| Open | Lowenstein Alice E | $533,750 | |
| Closed | Lowenstein Alice E | $533,850 | |
| Closed | Lowenstein Alice E | $62,150 |
Source: Public Records
Tax History
| Year | Tax Paid | Tax Assessment Tax Assessment Total Assessment is a certain percentage of the fair market value that is determined by local assessors to be the total taxable value of land and additions on the property. | Land | Improvement |
|---|---|---|---|---|
| 2025 | $31,020 | $3,142,900 | $1,479,400 | $1,663,500 |
| 2024 | $30,564 | $3,128,400 | $1,422,500 | $1,705,900 |
| 2023 | $30,455 | $3,054,700 | $1,316,200 | $1,738,500 |
| 2022 | $29,645 | $2,909,200 | $1,253,500 | $1,655,700 |
| 2021 | $27,414 | $2,797,300 | $1,205,300 | $1,592,000 |
| 2020 | $25,917 | $2,742,500 | $1,095,700 | $1,646,800 |
| 2019 | $24,474 | $2,611,900 | $1,043,500 | $1,568,400 |
| 2018 | $22,383 | $2,366,100 | $871,200 | $1,494,900 |
| 2017 | $21,645 | $2,190,800 | $821,900 | $1,368,900 |
| 2016 | $20,759 | $1,992,200 | $768,700 | $1,223,500 |
| 2015 | $18,704 | $1,751,300 | $658,600 | $1,092,700 |
| 2014 | $18,227 | $1,600,300 | $598,200 | $1,002,100 |
Source: Public Records
Map
Nearby Homes
- 58 Kent St Unit 302
- 58 Kent St Unit 403
- 58 Kent St Unit 304
- 58 Kent St Unit 404
- 19 Linden St
- 14 Linden St Unit 7
- 44 Washington St Unit 1103
- 44 Washington St Unit 605
- 148 Kent St Unit 148
- 69 Walnut St Unit 4
- 0 S Huntington Ave
- 33 Pond Ave Unit 603
- 33 Pond Ave Unit 919
- 33 Pond Ave Unit 1106
- 33 Pond Ave Unit 1014
- 33 Pond Ave Unit 1213
- 33 Pond Ave Unit 915
- 23 Netherlands Rd Unit 1
- 77 Pond Ave Unit 412
- 77 Pond Ave Unit 401
- 74 Kent St Unit C14
- 74 Kent St Unit C13
- 74 Kent St Unit C12
- 74 Kent St Unit C11
- 74 Kent St Unit C9
- 74 Kent St Unit C8
- 74 Kent St Unit C7
- 74 Kent St Unit C6
- 74 Kent St Unit C5
- 74 Kent St Unit C4
- 74 Kent St Unit C3
- 74 Kent St Unit C2
- 74 Kent St Unit C1
- 74 Kent St Unit 35
- 74 Kent St Unit 3
- 74 Kent St Unit 8
- 74 Kent St Unit C14,74
- 74 Kent St Unit CB
- 74 Kent St
- 74 Kent St Unit 1
Your Personal Tour Guide
Ask me questions while you tour the home.