N
Seller's Agent in 2015
NON MLS
NON MLS
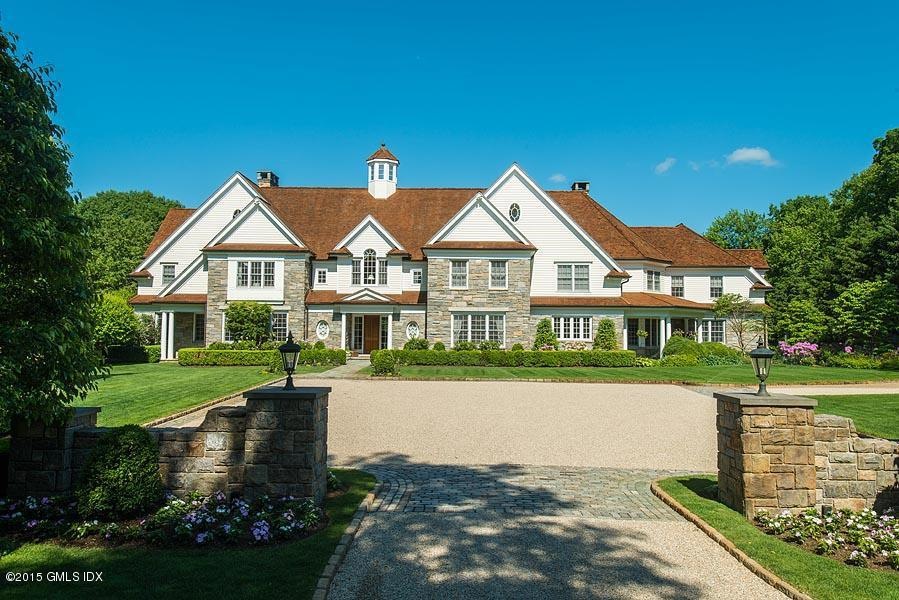


Estimated Value: $6,338,000 - $13,656,264
FOR REPORTING PURPOSES ONLY.
Last Agent to Sell the Property
NON MLS
NON MLS Listed on: 08/13/2015
Last Buyer's Agent
NON MLS
NON MLS Listed on: 08/13/2015
We collect this data history from publicly available records. To have your information removed, we recommend requesting removal directly through your county’s website.
We collect this data history from publicly available records. To have your information removed, we recommend requesting removal directly through your county’s website.
| Date | Buyer | Sale Price | Title Company |
|---|---|---|---|
| -- | -- | ||
| -- | -- | ||
| $4,500,000 | -- | ||
| $800,000 | -- | ||
| $800,000 | -- |
We collect this data history from publicly available records. To have your information removed, we recommend requesting removal directly through your county’s website.
| Date | Status | Borrower | Loan Amount |
|---|---|---|---|
| Open | $5,285,000 | ||
| Previous Owner | $2,000,000 |
We collect this data history from publicly available records. To have your information removed, we recommend requesting removal directly through your county’s website.
| Date | Event | Price | List to Sale | Price per Sq Ft |
|---|---|---|---|---|
| 08/13/2015 08/13/15 | Sold | $7,550,000 | 0.0% | $658 / Sq Ft |
| 08/13/2015 08/13/15 | Pending | -- | -- | -- |
| 08/13/2015 08/13/15 | For Sale | $7,550,000 | -- | $658 / Sq Ft |
We collect this data history from publicly available records. To have your information removed, we recommend requesting removal directly through your county’s website.
| Year | Tax Paid | Tax Assessment Tax Assessment Total Assessment is a certain percentage of the fair market value that is determined by local assessors to be the total taxable value of land and additions on the property. | Land | Improvement |
|---|---|---|---|---|
| 2025 | $67,502 | $5,606,510 | $1,438,290 | $4,168,220 |
| 2024 | $65,652 | $5,606,510 | $1,438,290 | $4,168,220 |
| 2023 | $63,858 | $5,606,510 | $1,438,290 | $4,168,220 |
| 2022 | $63,241 | $5,606,510 | $1,438,290 | $4,168,220 |
| 2021 | $67,753 | $5,845,840 | $1,099,560 | $4,746,280 |
| 2020 | $67,753 | $5,845,840 | $1,099,560 | $4,746,280 |
| 2019 | $68,279 | $5,845,840 | $1,099,560 | $4,746,280 |
| 2018 | $65,156 | $5,730,550 | $1,099,560 | $4,630,990 |
| 2017 | $65,156 | $5,730,550 | $1,099,560 | $4,630,990 |
| 2016 | $62,193 | $5,552,960 | $1,099,560 | $4,453,400 |
| 2015 | $95,777 | $8,498,420 | $3,499,510 | $4,998,910 |
| 2014 | $93,140 | $8,490,440 | $3,499,510 | $4,990,930 |
N
Seller's Agent in 2015
NON MLS
NON MLS
Source: Greenwich Association of REALTORS®
MLS Number: 94288
APN: GREE-000011-000000-003044
Disclaimer: Certain information contained herein is derived from information provided by parties other than Homes.com. All information provided is deemed reliable, but is not guaranteed to be accurate and should be independently verified.
![]() Listing data courtesy of Greenwich MLS. IDX information is provided exclusively for consumers’ personal, non-commercial use, that it may not be used for any purpose other than to
Listing data courtesy of Greenwich MLS. IDX information is provided exclusively for consumers’ personal, non-commercial use, that it may not be used for any purpose other than to
identify prospective properties consumers may be interested in purchasing. Data is deemed reliable but is not guaranteed accurate by the MLS.
Ask me questions while you tour the home.