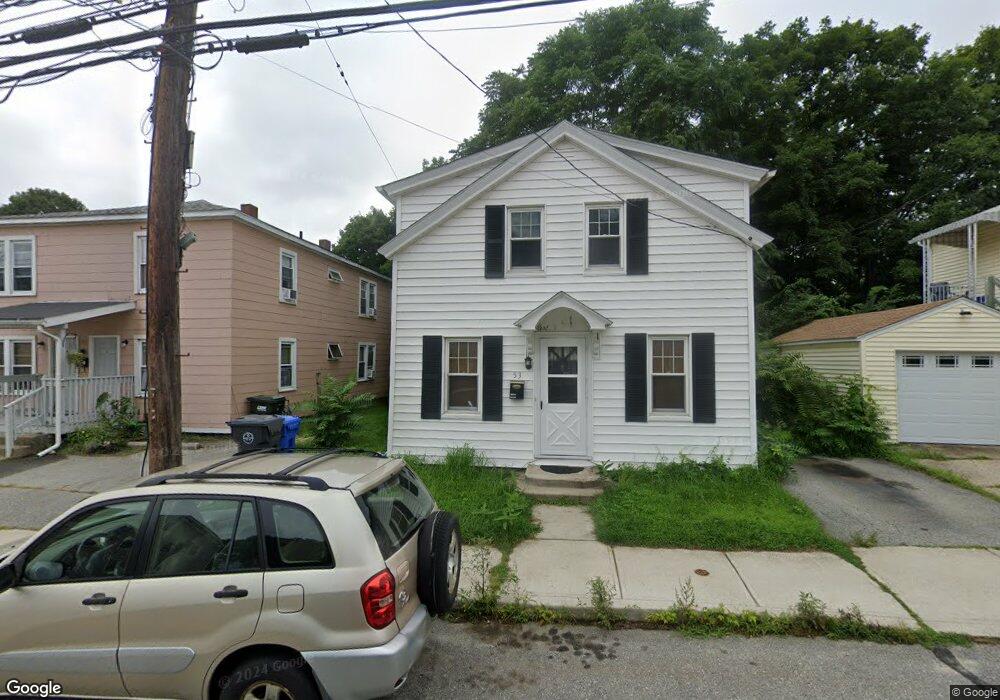
53 Mechanic St Danielson, CT 06239
Estimated Value: $202,000 - $295,000
3
Beds
1
Bath
1,120
Sq Ft
$224/Sq Ft
Est. Value
About This Home
This home is located at 53 Mechanic St, Danielson, CT 06239 and is currently estimated at $251,081, approximately $224 per square foot. 53 Mechanic St is a home located in Windham County with nearby schools including Killingly Central School, Killingly Memorial School, and Killingly Intermediate School.
Ownership History
Date
Name
Owned For
Owner Type
Purchase Details
Closed on
Mar 3, 2009
Sold by
Department Of Housing & Urban Dev
Bought by
Kelley Danielle E
Current Estimated Value
Home Financials for this Owner
Home Financials are based on the most recent Mortgage that was taken out on this home.
Original Mortgage
$78,550
Outstanding Balance
$48,078
Interest Rate
5%
Estimated Equity
$203,003
Purchase Details
Closed on
Sep 3, 2004
Sold by
Gladu Florence
Bought by
Oneill Brendan S and Oneill Stacy M
Create a Home Valuation Report for This Property
The Home Valuation Report is an in-depth analysis detailing your home's value as well as a comparison with similar homes in the area
Home Values in the Area
Average Home Value in this Area
Purchase History
We collect this data history from publicly available records. To have your information removed, we recommend requesting removal directly through your county’s website.
| Date | Buyer | Sale Price | Title Company |
|---|---|---|---|
| Kelley Danielle E | $80,000 | -- | |
| Kelley Danielle E | $80,000 | -- | |
| Oneill Brendan S | $115,000 | -- | |
| Oneill Brendan S | $115,000 | -- |
Source: Public Records
Mortgage History
We collect this data history from publicly available records. To have your information removed, we recommend requesting removal directly through your county’s website.
| Date | Status | Borrower | Loan Amount |
|---|---|---|---|
| Open | Oneill Brendan S | $78,550 | |
| Closed | Oneill Brendan S | $5,200 |
Source: Public Records
Tax History
| Year | Tax Paid | Tax Assessment Tax Assessment Total Assessment is a certain percentage of the fair market value that is determined by local assessors to be the total taxable value of land and additions on the property. | Land | Improvement |
|---|---|---|---|---|
| 2025 | $2,927 | $116,840 | $27,300 | $89,540 |
| 2024 | $2,794 | $116,840 | $27,300 | $89,540 |
| 2023 | $1,945 | $60,620 | $20,370 | $40,250 |
| 2022 | $1,830 | $60,620 | $20,370 | $40,250 |
| 2021 | $1,830 | $60,620 | $20,370 | $40,250 |
| 2020 | $1,800 | $60,620 | $20,370 | $40,250 |
| 2019 | $1,819 | $60,620 | $20,370 | $40,250 |
| 2017 | $1,411 | $43,750 | $12,950 | $30,800 |
| 2016 | $1,411 | $43,750 | $12,950 | $30,800 |
| 2015 | $1,383 | $43,750 | $12,950 | $30,800 |
| 2014 | $1,350 | $43,750 | $12,950 | $30,800 |
Source: Public Records
Map
Nearby Homes
Your Personal Tour Guide
Ask me questions while you tour the home.