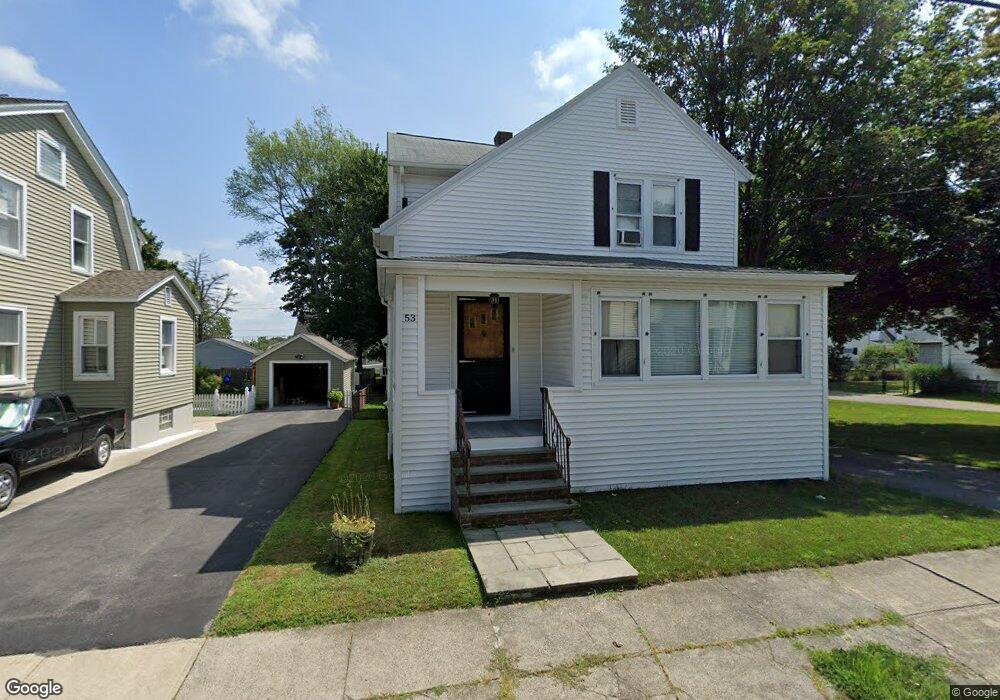
53 Moore St Fall River, MA 02720
Highlands-Fall River NeighborhoodEstimated Value: $410,000 - $434,000
3
Beds
2
Baths
1,571
Sq Ft
$268/Sq Ft
Est. Value
About This Home
This home is located at 53 Moore St, Fall River, MA 02720 and is currently estimated at $421,204, approximately $268 per square foot. 53 Moore St is a home located in Bristol County with nearby schools including Spencer Borden Elementary School, Morton Middle School, and B M C Durfee High School.
Ownership History
Date
Name
Owned For
Owner Type
Purchase Details
Closed on
Jun 14, 2010
Sold by
Morais Joseph and Morais Anne M
Bought by
Morais Ft
Current Estimated Value
Create a Home Valuation Report for This Property
The Home Valuation Report is an in-depth analysis detailing your home's value as well as a comparison with similar homes in the area
Home Values in the Area
Average Home Value in this Area
Purchase History
| Date | Buyer | Sale Price | Title Company |
|---|---|---|---|
| Morais Ft | -- | -- |
Source: Public Records
Tax History
| Year | Tax Paid | Tax Assessment Tax Assessment Total Assessment is a certain percentage of the fair market value that is determined by local assessors to be the total taxable value of land and additions on the property. | Land | Improvement |
|---|---|---|---|---|
| 2025 | $4,211 | $367,800 | $133,600 | $234,200 |
| 2024 | $3,987 | $347,000 | $128,400 | $218,600 |
| 2023 | $3,964 | $323,100 | $115,300 | $207,800 |
| 2022 | $3,546 | $281,000 | $106,700 | $174,300 |
| 2021 | $3,561 | $257,500 | $100,800 | $156,700 |
| 2020 | $3,348 | $231,700 | $97,000 | $134,700 |
| 2019 | $3,313 | $227,200 | $97,000 | $130,200 |
| 2018 | $3,197 | $218,700 | $97,000 | $121,700 |
| 2017 | $3,031 | $216,500 | $97,000 | $119,500 |
| 2016 | $2,869 | $210,500 | $97,000 | $113,500 |
| 2015 | $2,684 | $205,200 | $90,700 | $114,500 |
| 2014 | $2,581 | $205,200 | $90,700 | $114,500 |
Source: Public Records
Map
Nearby Homes
- 63 Moore St
- 31 Moore St
- 73 Moore St
- 26 Elsbree St
- 896 New Boston Rd
- 42 Moore St
- 60 Moore St
- 58 Elsbree St
- 874 New Boston Rd
- 910 New Boston Rd
- 886 New Boston Rd
- 886 New Boston Rd Unit 1
- 257 Rathgar St
- 916 New Boston Rd
- 99 Moore St
- 24 Moore St
- 926 New Boston Rd
- 260 Rathgar St
- 237 Rathgar St
- 6 Elsbree St Unit 6
Your Personal Tour Guide
Ask me questions while you tour the home.