53 Nelson St Braintree, MA 02184
East Braintree NeighborhoodEstimated Value: $586,000 - $669,697
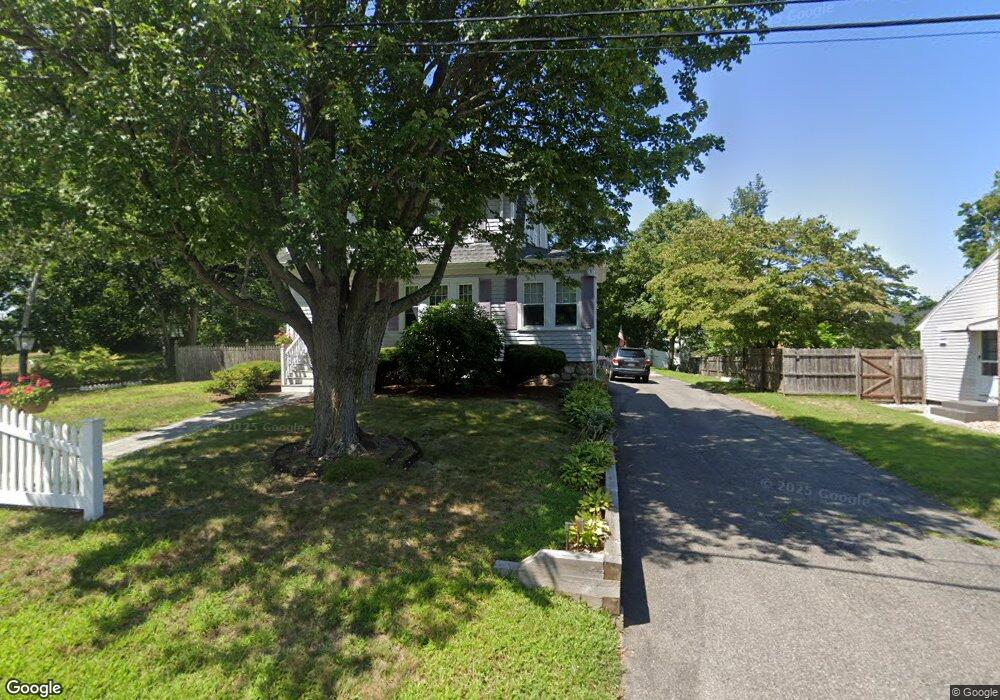
About This Home
This home is located at 53 Nelson St, Braintree, MA 02184 and is currently estimated at $628,424, approximately $494 per square foot. 53 Nelson St is a home located in Norfolk County with nearby schools including Braintree High School, Sacred Heart Elementary School, and South Shore Christian Academy.
Ownership History
We collect this data history from publicly available records. To have your information removed, we recommend requesting removal directly through your county’s website.
Purchase Details
Home Values in the Area
Average Home Value in this Area
Purchase History
We collect this data history from publicly available records. To have your information removed, we recommend requesting removal directly through your county’s website.
| Date | Buyer | Sale Price | Title Company |
|---|---|---|---|
| $145,500 | -- |
Mortgage History
We collect this data history from publicly available records. To have your information removed, we recommend requesting removal directly through your county’s website.
| Date | Status | Borrower | Loan Amount |
|---|---|---|---|
| Open | $30,000 | ||
| Open | $148,000 | ||
| Closed | $129,500 | ||
| Closed | $142,000 | ||
| Closed | $25,000 |
Tax History
We collect this data history from publicly available records. To have your information removed, we recommend requesting removal directly through your county’s website.
| Year | Tax Paid | Tax Assessment Tax Assessment Total Assessment is a certain percentage of the fair market value that is determined by local assessors to be the total taxable value of land and additions on the property. | Land | Improvement |
|---|---|---|---|---|
| 2025 | $5,972 | $598,400 | $350,400 | $248,000 |
| 2024 | $5,392 | $568,800 | $326,700 | $242,100 |
| 2023 | $5,097 | $522,200 | $293,600 | $228,600 |
| 2022 | $4,913 | $493,800 | $265,200 | $228,600 |
| 2021 | $4,524 | $454,700 | $239,600 | $215,100 |
| 2020 | $4,176 | $423,500 | $217,800 | $205,700 |
| 2019 | $4,050 | $401,400 | $208,300 | $193,100 |
| 2018 | $3,946 | $374,400 | $189,400 | $185,000 |
| 2017 | $3,804 | $354,200 | $179,900 | $174,300 |
| 2016 | $3,496 | $318,400 | $151,500 | $166,900 |
| 2015 | $3,437 | $310,500 | $149,600 | $160,900 |
| 2014 | $3,256 | $285,100 | $136,400 | $148,700 |
Map
- 7 Somerville Ave
- 16 Cotton Ave
- 25 Fairmount Ave
- 77 Thayer Rd
- 10 Willow St
- 29 Wilkins Rd
- 153 Commercial St Unit 5
- 296 Commercial St Unit 21
- 41 Lantern Ln
- 37 Lantern Ln
- 30 Skyline Dr Unit 6
- 37 Skyline Dr Unit 11
- 11 Brookside Rd Unit 3
- 11 Brookside Rd Unit 6
- 67 Washington St
- 15 Bower Rd Unit E1
- 15 Bower Rd Unit F5
- 179 Liberty St
- 27 Lawnview Dr
- 27 Cindy Ln
Ask me questions while you tour the home.