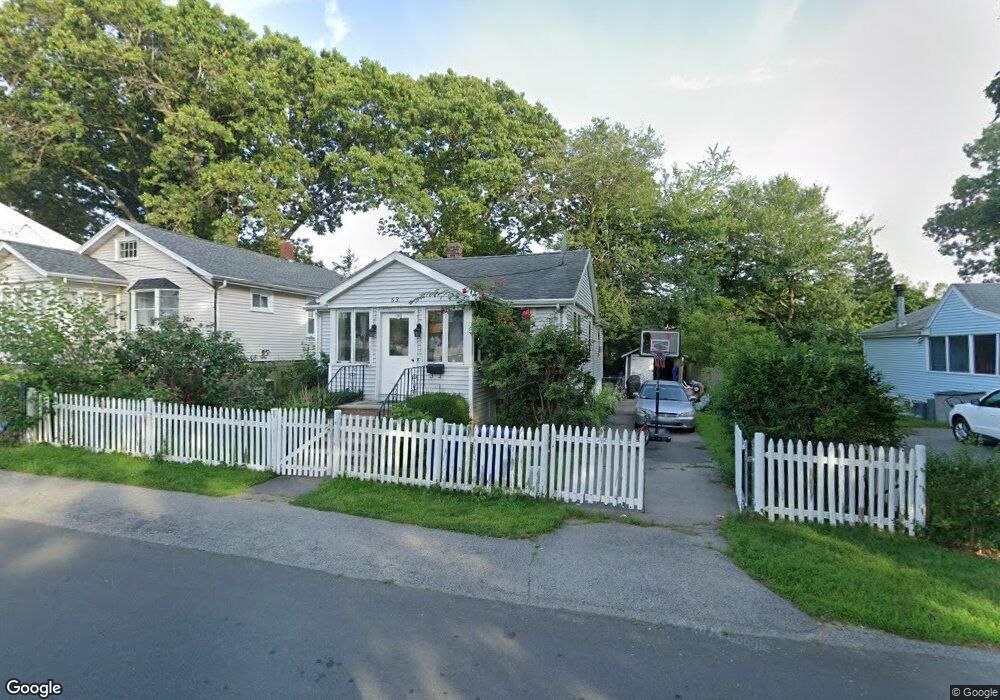
53 Wilkins Rd Braintree, MA 02184
East Braintree NeighborhoodEstimated Value: $516,851 - $613,000
2
Beds
1
Bath
881
Sq Ft
$631/Sq Ft
Est. Value
About This Home
This home is located at 53 Wilkins Rd, Braintree, MA 02184 and is currently estimated at $555,713, approximately $630 per square foot. 53 Wilkins Rd is a home located in Norfolk County with nearby schools including Braintree High School, Step Ahead Kindergarten, and Sacred Heart Elementary School.
Ownership History
Date
Name
Owned For
Owner Type
Purchase Details
Closed on
Nov 16, 2001
Sold by
Bidorini Robert H and Bidorini Susan J
Bought by
Sakunchotpanit Suchart and Sakunchotpanit Orlaluk
Current Estimated Value
Home Financials for this Owner
Home Financials are based on the most recent Mortgage that was taken out on this home.
Original Mortgage
$175,900
Outstanding Balance
$66,381
Interest Rate
6.7%
Mortgage Type
Purchase Money Mortgage
Estimated Equity
$489,332
Purchase Details
Closed on
Jan 18, 1991
Sold by
Toohey Charles
Bought by
Bidorini Robert H and Bidorini Susan J
Home Financials for this Owner
Home Financials are based on the most recent Mortgage that was taken out on this home.
Original Mortgage
$117,864
Interest Rate
9.68%
Mortgage Type
Purchase Money Mortgage
Create a Home Valuation Report for This Property
The Home Valuation Report is an in-depth analysis detailing your home's value as well as a comparison with similar homes in the area
Home Values in the Area
Average Home Value in this Area
Purchase History
| Date | Buyer | Sale Price | Title Company |
|---|---|---|---|
| Sakunchotpanit Suchart | $219,900 | -- | |
| Bidorini Robert H | $117,600 | -- | |
| Bidorini Robert H | $117,600 | -- |
Source: Public Records
Mortgage History
| Date | Status | Borrower | Loan Amount |
|---|---|---|---|
| Open | Sakunchotpanit Suchart | $175,900 | |
| Previous Owner | Bidorini Robert H | $117,864 |
Source: Public Records
Tax History
| Year | Tax Paid | Tax Assessment Tax Assessment Total Assessment is a certain percentage of the fair market value that is determined by local assessors to be the total taxable value of land and additions on the property. | Land | Improvement |
|---|---|---|---|---|
| 2025 | $5,130 | $514,000 | $339,500 | $174,500 |
| 2024 | $4,611 | $486,400 | $318,300 | $168,100 |
| 2023 | $4,325 | $443,100 | $280,100 | $163,000 |
| 2022 | $4,155 | $417,600 | $254,600 | $163,000 |
| 2021 | $3,558 | $357,600 | $214,700 | $142,900 |
| 2020 | $3,476 | $352,500 | $214,700 | $137,800 |
| 2019 | $3,381 | $335,100 | $214,700 | $120,400 |
| 2018 | $3,195 | $303,100 | $186,700 | $116,400 |
| 2017 | $3,073 | $286,100 | $169,700 | $116,400 |
| 2016 | $2,886 | $262,800 | $152,800 | $110,000 |
| 2015 | $2,832 | $255,800 | $149,400 | $106,400 |
| 2014 | $2,785 | $243,900 | $137,500 | $106,400 |
Source: Public Records
Map
Nearby Homes
- 18 Hobart St
- 300 Commercial St Unit 23
- 30 Skyline Dr Unit 6
- 37 Skyline Dr Unit 11
- 599 Union St
- 82 Cotton Ave
- 14 Hillside Rd
- 54 Edgemont Rd
- 140 Commercial St
- 25 W Howard St Unit C3
- 15 Bower Rd Unit F9
- 41 Lantern Ln
- 37 Lantern Ln
- 17 White Rd
- 67 Trefton Dr
- 200 Falls Blvd Unit E101
- 200 Falls Blvd Unit B305
- 21 Spaulding St
- 87 Arborway Dr
- 36 Chestnut Ave
Your Personal Tour Guide
Ask me questions while you tour the home.