
Seller's Agent in 2025
Kristi Christensen
Better Properties Mason County
(360) 470-2824
222 Total Sales
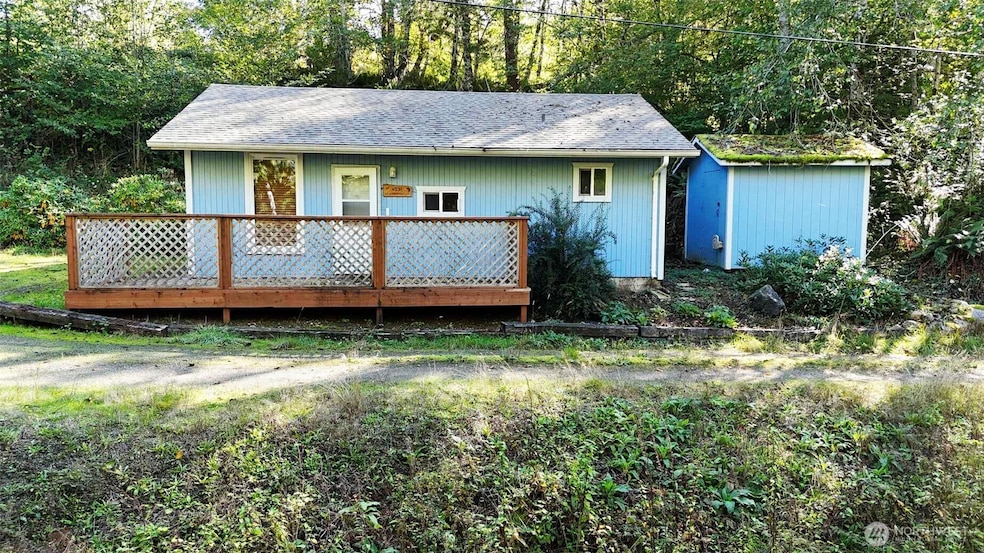


Discover this adorable 660 sq ft home tucked away in the serene Lake Arrowhead community. Perfectly sized for a cozy getaway, or full-time living, this property offers peace and privacy.Inside, you’ll find an open living room and kitchen, a comfortable bedroom and full bathroom along with a washer and dryer for convenience. The open living area feels warm and inviting—ideal for relaxing after a day at the lake or exploring the local trails. Outside, enjoy the quiet surroundings and your detached two-car garage, providing plenty of space for parking or storage. Located in a quiet and desirable area, this little gem is your chance to own an affordable slice of Lake Arrowhead life!
Last Agent to Sell the Property
Better Properties Mason County License #23007534 Listed on: 10/10/2025
Source: Northwest Multiple Listing Service (NWMLS)
MLS#: 2442748
| Date | Type | Sale Price | Title Company |
|---|---|---|---|
| Warranty Deed | $204,900 | Chicago Title | |
| Warranty Deed | $150,000 | Olympic Title Company | |
| Warranty Deed | $110,000 | Mason County Title Ins Co | |
| Warranty Deed | $89,000 | Mason County Title Ins Co |
| Date | Status | Loan Amount | Loan Type |
|---|---|---|---|
| Open | $204,900 | VA | |
| Previous Owner | $119,025 | New Conventional | |
| Previous Owner | $88,000 | New Conventional | |
| Previous Owner | $84,550 | New Conventional |
| Date | Event | Price | List to Sale | Price per Sq Ft |
|---|---|---|---|---|
| 11/18/2025 11/18/25 | Sold | $204,900 | +2.5% | $310 / Sq Ft |
| 10/20/2025 10/20/25 | Pending | -- | -- | -- |
| 10/10/2025 10/10/25 | For Sale | $199,900 | -- | $303 / Sq Ft |
| Year | Tax Paid | Tax Assessment Tax Assessment Total Assessment is a certain percentage of the fair market value that is determined by local assessors to be the total taxable value of land and additions on the property. | Land | Improvement |
|---|---|---|---|---|
| 2025 | $1,229 | $160,560 | $5,060 | $155,500 |
| 2023 | $1,229 | $166,895 | $10,430 | $156,465 |
| 2022 | $1,293 | $134,965 | $8,020 | $126,945 |
| 2021 | $1,267 | $134,965 | $8,020 | $126,945 |
| 2020 | $1,042 | $123,140 | $8,020 | $115,120 |
| 2018 | $1,006 | $80,030 | $10,500 | $69,530 |
| 2017 | $938 | $80,030 | $10,500 | $69,530 |
| 2016 | $952 | $82,040 | $10,500 | $71,540 |
| 2015 | $975 | $82,565 | $11,025 | $71,540 |
| 2014 | -- | $84,530 | $11,025 | $73,505 |
| 2013 | -- | $85,190 | $11,025 | $74,165 |
Seller's Agent in 2025
Kristi Christensen
Better Properties Mason County
(360) 470-2824
222 Total Sales
B
Seller Co-Listing Agent in 2025
Brook Raines
Better Properties Grays Harbor
(360) 581-0007
153 Total Sales
Buyer's Agent in 2025
Jaclyn Messer
eXp Realty
(360) 386-5505
154 Total Sales
Source: Northwest Multiple Listing Service (NWMLS)
MLS Number: 2442748
APN: 51917-50-00061
Disclaimer: Certain information contained herein is derived from information provided by parties other than Homes.com. All information provided is deemed reliable, but is not guaranteed to be accurate and should be independently verified.
![]() All data is obtained from various sources and may not have been verified by broker or MLS GRID. Supplied Open House Information is subject to change without notice. All information should be independently reviewed and verified for accuracy. Properties may or may not be listed by the office/agent presenting the information. Listing information is provided by the Northwest Multiple Listing Service (NWMLS). Property information is based on available data that may include MLS information, county records, and other sources. Listings marked with the 3 tree icon and provided by NWMLS. All properties are subject to prior sale or withdrawal. IDX information is provided exclusively for consumers’ personal noncommercial use, that it may not be used for any purpose other than to identify prospective properties consumers may be interested in purchasing, that the data is deemed reliable but is not guaranteed by MLS GRID. ©2026 NWMLS.
All data is obtained from various sources and may not have been verified by broker or MLS GRID. Supplied Open House Information is subject to change without notice. All information should be independently reviewed and verified for accuracy. Properties may or may not be listed by the office/agent presenting the information. Listing information is provided by the Northwest Multiple Listing Service (NWMLS). Property information is based on available data that may include MLS information, county records, and other sources. Listings marked with the 3 tree icon and provided by NWMLS. All properties are subject to prior sale or withdrawal. IDX information is provided exclusively for consumers’ personal noncommercial use, that it may not be used for any purpose other than to identify prospective properties consumers may be interested in purchasing, that the data is deemed reliable but is not guaranteed by MLS GRID. ©2026 NWMLS.
Based on information submitted to the MLS GRID
Ask me questions while you tour the home.