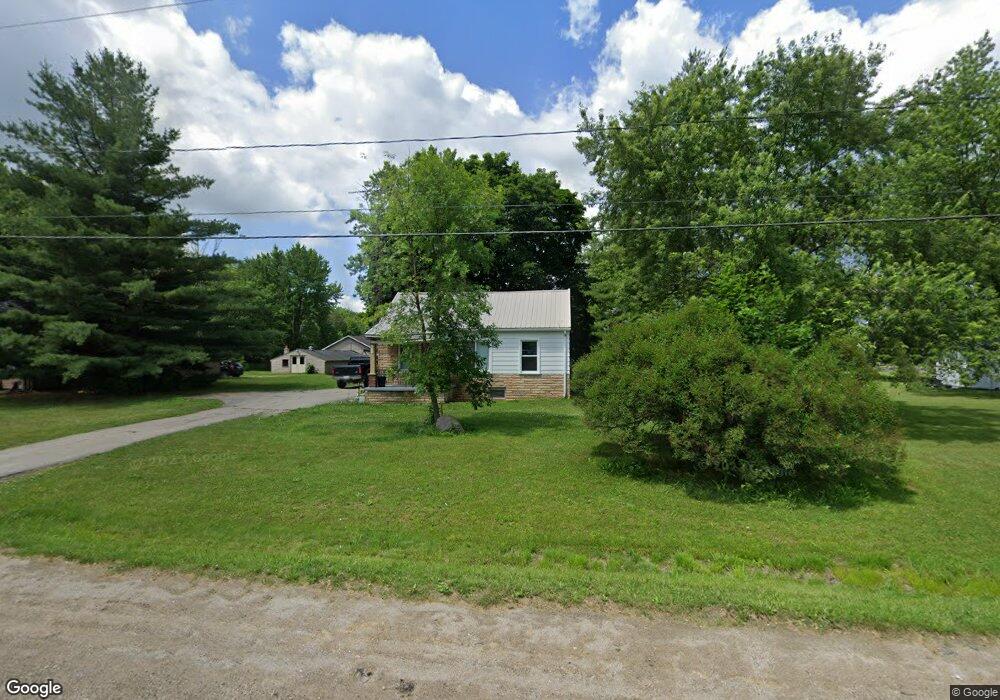
5329 N State Rd Davison, MI 48423
Estimated Value: $145,000 - $196,000
3
Beds
1
Bath
942
Sq Ft
$175/Sq Ft
Est. Value
About This Home
This home is located at 5329 N State Rd, Davison, MI 48423 and is currently estimated at $165,008, approximately $175 per square foot. 5329 N State Rd is a home located in Genesee County with nearby schools including Thomson Elementary School, Siple Elementary School, and Hill Elementary School.
Ownership History
Date
Name
Owned For
Owner Type
Purchase Details
Closed on
Sep 28, 2016
Sold by
Scaman Richard and Scaman Rosemary
Bought by
R & R Property Managment Llc
Current Estimated Value
Purchase Details
Closed on
Feb 6, 2006
Sold by
Jackson Alphonso R and Hud
Bought by
Seaman Richard and Seaman Rosemary
Purchase Details
Closed on
Aug 16, 2005
Sold by
Countrywide Home Loans Inc
Bought by
Hud
Purchase Details
Closed on
Feb 9, 2005
Sold by
Leland Garth H
Bought by
Countrywide Home Loans Inc and Countrywide Home Loans Servicing Lp
Purchase Details
Closed on
Dec 6, 2001
Sold by
Estate Of Rose June Bush
Bought by
Leland Garth H
Purchase Details
Closed on
Jun 6, 2001
Sold by
Alward Robert and Estate Of Rose June Bush
Bought by
Alward Robert and Alward Barbara
Create a Home Valuation Report for This Property
The Home Valuation Report is an in-depth analysis detailing your home's value as well as a comparison with similar homes in the area
Home Values in the Area
Average Home Value in this Area
Purchase History
We collect this data history from publicly available records. To have your information removed, we recommend requesting removal directly through your county’s website.
| Date | Buyer | Sale Price | Title Company |
|---|---|---|---|
| R & R Property Managment Llc | -- | None Available | |
| Seaman Richard | $72,000 | Guaranty Title Company | |
| Hud | -- | -- | |
| Countrywide Home Loans Inc | $96,041 | -- | |
| Leland Garth H | $83,000 | Cislo Title Company | |
| Alward Robert | -- | -- |
Source: Public Records
Tax History
| Year | Tax Paid | Tax Assessment Tax Assessment Total Assessment is a certain percentage of the fair market value that is determined by local assessors to be the total taxable value of land and additions on the property. | Land | Improvement |
|---|---|---|---|---|
| 2025 | $333 | $52,800 | $0 | $0 |
| 2024 | $324 | $48,700 | $0 | $0 |
| 2023 | $309 | $43,800 | $0 | $0 |
| 2022 | $1,541 | $37,500 | $0 | $0 |
| 2021 | $1,532 | $32,500 | $0 | $0 |
| 2020 | $283 | $31,500 | $0 | $0 |
| 2019 | $278 | $27,600 | $0 | $0 |
| 2018 | $1,077 | $23,600 | $0 | $0 |
| 2017 | $1,342 | $23,600 | $0 | $0 |
| 2016 | $1,074 | $23,600 | $0 | $0 |
| 2015 | $851 | $24,200 | $0 | $0 |
| 2014 | $203 | $23,500 | $0 | $0 |
| 2012 | -- | $24,300 | $24,300 | $0 |
Source: Public Records
Map
Nearby Homes
- 9384 Sandy Hollow Ln Unit 48
- 9344 Sandy Hollow Ln Unit 43
- 6063 N State Rd
- 10247 E Coldwater Rd
- 5183 N Oak Rd
- 543 Continental Cir
- 9377 Hubbard Rd
- 4347 N Gale Rd
- 4091 N State Rd
- 9805 E Richfield Rd
- 9607 Creek View Ct Unit 104
- 3365 Meadow Ridge Ct
- 1240 N Irish Rd
- 5460 N Henderson Rd
- 5165 N Irish Rd
- 5189 N Irish Rd
- 5177 N Irish Rd
- 6058 Thomas St
- 2444 E Stanley Rd
- vacant land Dublin Way
- 5319 N State Rd
- 5313 N State Rd
- 5345 N State Rd
- 5297 N State Rd
- 5353 N State Rd
- 5334 N State Rd
- 5344 N State Rd
- 5324 N State Rd
- 5314 N State Rd
- 5304 N State Rd
- 5304 N State Rd
- 5363 N State Rd
- 5292 N State Rd
- 5273 N State Rd
- 5276 N State Rd
- 5259 N State Rd
- 5283 N State Rd
- 10033 Clark Rd
- 5397 N State Rd
- 5241 N State Rd
Your Personal Tour Guide
Ask me questions while you tour the home.