535 Front St Weymouth, MA 02188
East Weymouth NeighborhoodEstimated Value: $689,000 - $851,000
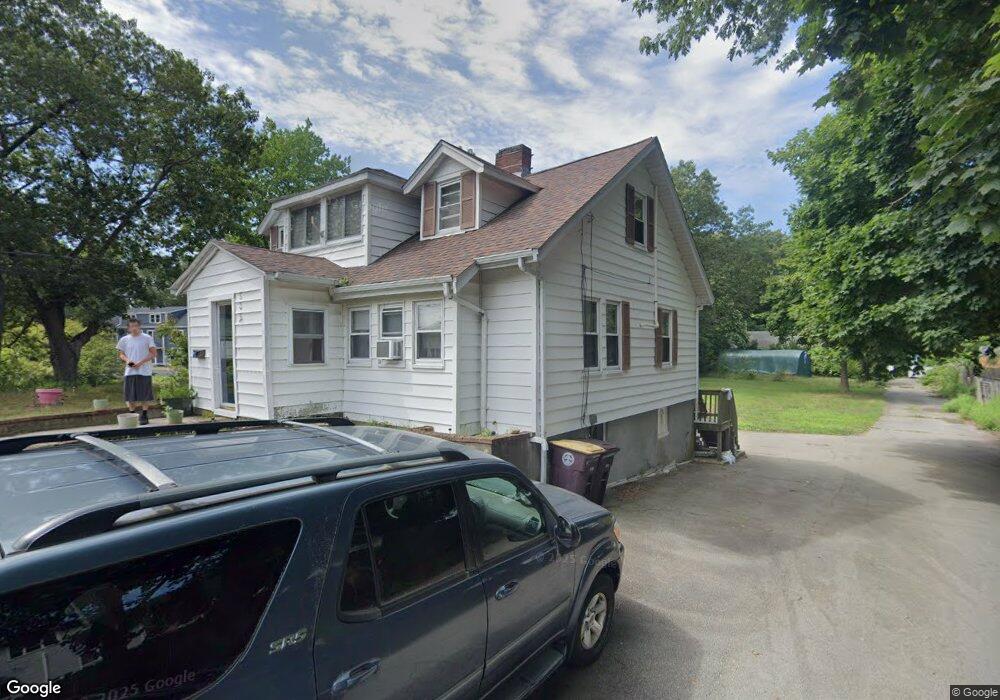
About This Home
This home is located at 535 Front St, Weymouth, MA 02188 and is currently estimated at $764,576, approximately $313 per square foot. 535 Front St is a home located in Norfolk County with nearby schools including Frederick C Murphy, Abigail Adams Middle School, and Weymouth Middle School Chapman.
Ownership History
We collect this data history from publicly available records. To have your information removed, we recommend requesting removal directly through your county’s website.
Purchase Details
Home Financials for this Owner
Home Financials are based on the most recent Mortgage that was taken out on this home.Home Values in the Area
Average Home Value in this Area
Purchase History
We collect this data history from publicly available records. To have your information removed, we recommend requesting removal directly through your county’s website.
| Date | Buyer | Sale Price | Title Company |
|---|---|---|---|
| $146,700 | -- |
Mortgage History
We collect this data history from publicly available records. To have your information removed, we recommend requesting removal directly through your county’s website.
| Date | Status | Borrower | Loan Amount |
|---|---|---|---|
| Open | $158,000 | ||
| Previous Owner | $25,000 |
Tax History
We collect this data history from publicly available records. To have your information removed, we recommend requesting removal directly through your county’s website.
| Year | Tax Paid | Tax Assessment Tax Assessment Total Assessment is a certain percentage of the fair market value that is determined by local assessors to be the total taxable value of land and additions on the property. | Land | Improvement |
|---|---|---|---|---|
| 2025 | $6,397 | $633,400 | $213,400 | $420,000 |
| 2024 | $6,197 | $603,400 | $203,300 | $400,100 |
| 2023 | $6,001 | $574,300 | $188,200 | $386,100 |
| 2022 | $5,816 | $507,500 | $174,300 | $333,200 |
| 2021 | $5,604 | $477,300 | $174,300 | $303,000 |
| 2020 | $5,407 | $453,600 | $174,300 | $279,300 |
| 2019 | $5,272 | $435,000 | $167,600 | $267,400 |
| 2018 | $4,854 | $388,300 | $159,600 | $228,700 |
| 2017 | $4,431 | $345,900 | $152,000 | $193,900 |
| 2016 | $4,159 | $324,900 | $146,200 | $178,700 |
| 2015 | $3,984 | $308,800 | $146,200 | $162,600 |
| 2014 | $3,902 | $293,400 | $136,000 | $157,400 |
Map
- 64 Browning St
- 43 Aster Cir
- 52 Circuit Ave
- 3 Nob Hill Rd
- 229 Summer St
- 215 Winter St Unit 2F
- 215 Winter St Unit 1F
- 8 Tara Dr Unit 7
- 5 Tara Dr Unit 5
- 2 Tara Dr Unit 11
- 6 Tara Dr Unit 5
- 377 Summer St
- 50 Sherricks Farm Rd
- 13 Alden Rd
- 774 Middle St
- 82 Lester Ln
- 129 Greenvale Ave
- 53 Concannon Cir
- 40 Kingman St
- 80 Kensington Rd
Ask me questions while you tour the home.