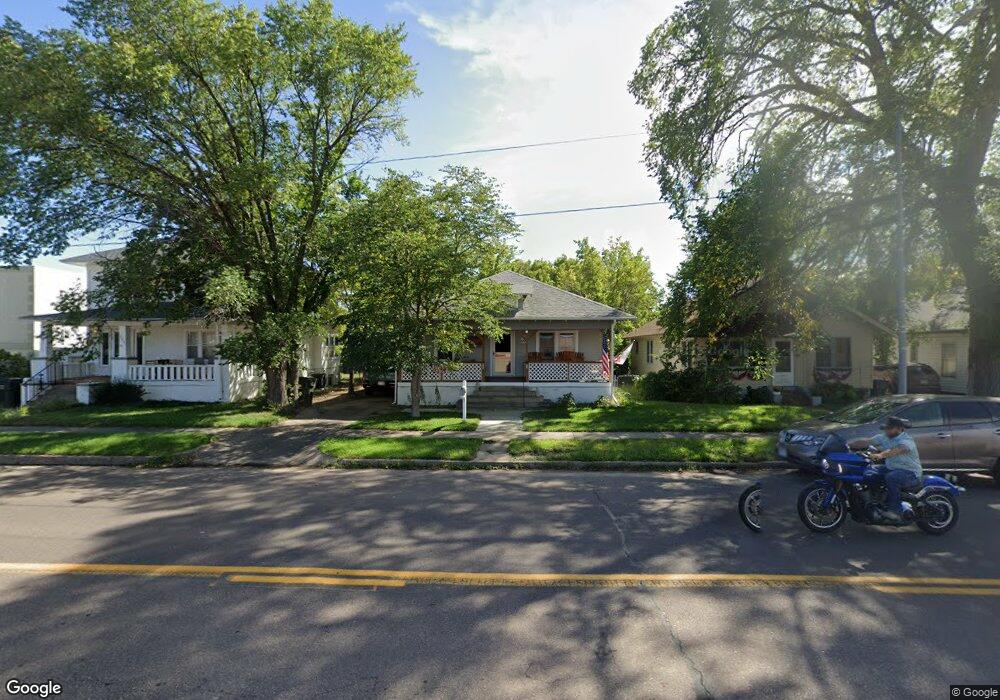
535 Illinois St Sidney, NE 69162
Estimated Value: $101,911 - $151,000
3
Beds
1
Bath
1,120
Sq Ft
$108/Sq Ft
Est. Value
About This Home
This home is located at 535 Illinois St, Sidney, NE 69162 and is currently estimated at $120,728, approximately $107 per square foot. 535 Illinois St is a home located in Cheyenne County with nearby schools including Central Elementary School, North Ward Elementary School, and South Ward Elementary School.
Ownership History
Date
Name
Owned For
Owner Type
Purchase Details
Closed on
Jul 27, 2018
Sold by
Vanvleet Robert D
Bought by
Rickard Michael and Rickard Lisa
Current Estimated Value
Purchase Details
Closed on
Jan 28, 2013
Sold by
Shelley Dustin
Bought by
Dds Investments Llc
Purchase Details
Closed on
Sep 27, 2010
Sold by
Federal National Mortgage Association
Bought by
Shelley Dustin D
Purchase Details
Closed on
Dec 16, 2009
Sold by
Tierone Bank
Bought by
Federal National Mortgage Association
Create a Home Valuation Report for This Property
The Home Valuation Report is an in-depth analysis detailing your home's value as well as a comparison with similar homes in the area
Home Values in the Area
Average Home Value in this Area
Purchase History
| Date | Buyer | Sale Price | Title Company |
|---|---|---|---|
| Rickard Michael | $35,500 | -- | |
| Dds Investments Llc | -- | -- | |
| Shelley Dustin D | -- | -- | |
| Federal National Mortgage Association | -- | -- |
Source: Public Records
Tax History
| Year | Tax Paid | Tax Assessment Tax Assessment Total Assessment is a certain percentage of the fair market value that is determined by local assessors to be the total taxable value of land and additions on the property. | Land | Improvement |
|---|---|---|---|---|
| 2025 | -- | $55,525 | $11,225 | $44,300 |
| 2024 | $1,140 | $50,940 | $10,300 | $40,640 |
| 2023 | $1,140 | $50,432 | $10,300 | $40,132 |
| 2022 | $1,077 | $46,455 | $10,300 | $36,155 |
| 2021 | $1,028 | $43,975 | $10,300 | $33,675 |
| 2020 | $921 | $39,461 | $8,956 | $30,505 |
| 2019 | $882 | $38,046 | $8,956 | $29,090 |
| 2018 | $975 | $42,992 | $10,414 | $32,578 |
| 2017 | $1,118 | $49,990 | $12,109 | $37,881 |
| 2016 | $1,069 | $49,990 | $12,109 | $37,881 |
| 2015 | $1,070 | $49,448 | $12,109 | $37,339 |
| 2014 | $1,109 | $49,448 | $12,109 | $37,339 |
Source: Public Records
Map
Nearby Homes
- 935 Illinois St
- 1229 Linden St
- 539 Keller Dr
- 1539 Jackson St
- 1220 Quince St
- 1940 Elm St
- 829 Olsen Dr
- 1905 Sidney Draw Rd
- 2446 El Rancho Rd
- 1362 Mission Dr
- 2659 Verde Ln
- 801 Deervalley Dr
- 801 Deer Valley Dr
- 10562 Road 22
- 11732 Road 32nd Unit Sidney NE 69162
- 11732 Road 32
- 0 Tbd Cr 78 Unit 11679084
- 0 Tbd Cr 78 Unit 26703132
- 0 Tbd Cr 78 Unit 26703131
- 0 Tbd Cr 78 Unit 11679082
Your Personal Tour Guide
Ask me questions while you tour the home.