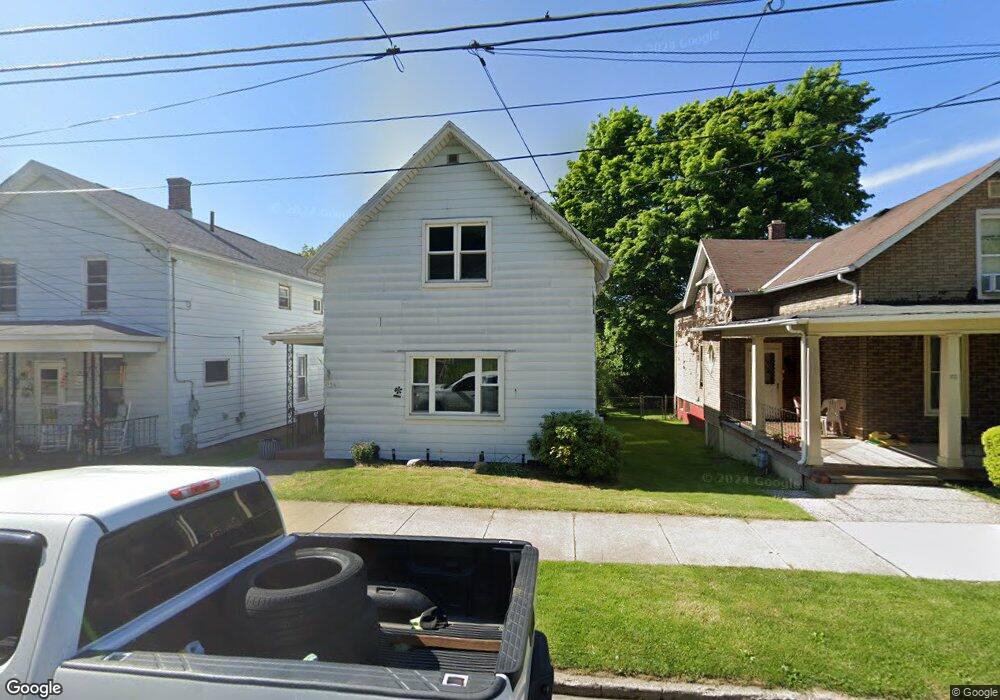
536 E 27th St Erie, PA 16504
Marvintown NeighborhoodEstimated Value: $105,000 - $140,000
5
Beds
2
Baths
1,906
Sq Ft
$64/Sq Ft
Est. Value
About This Home
This home is located at 536 E 27th St, Erie, PA 16504 and is currently estimated at $122,473, approximately $64 per square foot. 536 E 27th St is a home located in Erie County with nearby schools including Lincoln Elementary School, Woodrow Wilson Middle School, and Erie High School.
Ownership History
Date
Name
Owned For
Owner Type
Purchase Details
Closed on
Jun 8, 2007
Sold by
Cross Margaret and Roach James
Bought by
Lester Rosheemah A
Current Estimated Value
Home Financials for this Owner
Home Financials are based on the most recent Mortgage that was taken out on this home.
Original Mortgage
$55,290
Outstanding Balance
$33,740
Interest Rate
6.14%
Mortgage Type
Purchase Money Mortgage
Estimated Equity
$88,733
Purchase Details
Closed on
Oct 6, 2000
Sold by
Catherine Roach
Bought by
Roach Catherine and Cross Margaret
Purchase Details
Closed on
Jan 5, 1999
Sold by
Roach Fred J and Roach Catherine
Bought by
Roach Catherine
Create a Home Valuation Report for This Property
The Home Valuation Report is an in-depth analysis detailing your home's value as well as a comparison with similar homes in the area
Home Values in the Area
Average Home Value in this Area
Purchase History
| Date | Buyer | Sale Price | Title Company |
|---|---|---|---|
| Lester Rosheemah A | $57,000 | None Available | |
| Roach Catherine | -- | -- | |
| Roach Catherine | -- | -- |
Source: Public Records
Mortgage History
| Date | Status | Borrower | Loan Amount |
|---|---|---|---|
| Open | Lester Rosheemah A | $55,290 |
Source: Public Records
Tax History
| Year | Tax Paid | Tax Assessment Tax Assessment Total Assessment is a certain percentage of the fair market value that is determined by local assessors to be the total taxable value of land and additions on the property. | Land | Improvement |
|---|---|---|---|---|
| 2025 | $2,341 | $59,220 | $17,100 | $42,120 |
| 2024 | $2,291 | $59,220 | $17,100 | $42,120 |
| 2023 | $2,226 | $59,220 | $17,100 | $42,120 |
| 2022 | $2,179 | $59,220 | $17,100 | $42,120 |
| 2021 | $2,149 | $59,220 | $17,100 | $42,120 |
| 2020 | $2,134 | $59,220 | $17,100 | $42,120 |
| 2019 | $2,022 | $59,220 | $17,100 | $42,120 |
| 2018 | $1,999 | $59,220 | $17,100 | $42,120 |
| 2017 | $1,995 | $59,220 | $17,100 | $42,120 |
| 2016 | $1,912 | $59,220 | $17,100 | $42,120 |
| 2015 | $1,898 | $59,220 | $17,100 | $42,120 |
| 2014 | $1,592 | $59,220 | $17,100 | $42,120 |
Source: Public Records
Map
Nearby Homes
Your Personal Tour Guide
Ask me questions while you tour the home.