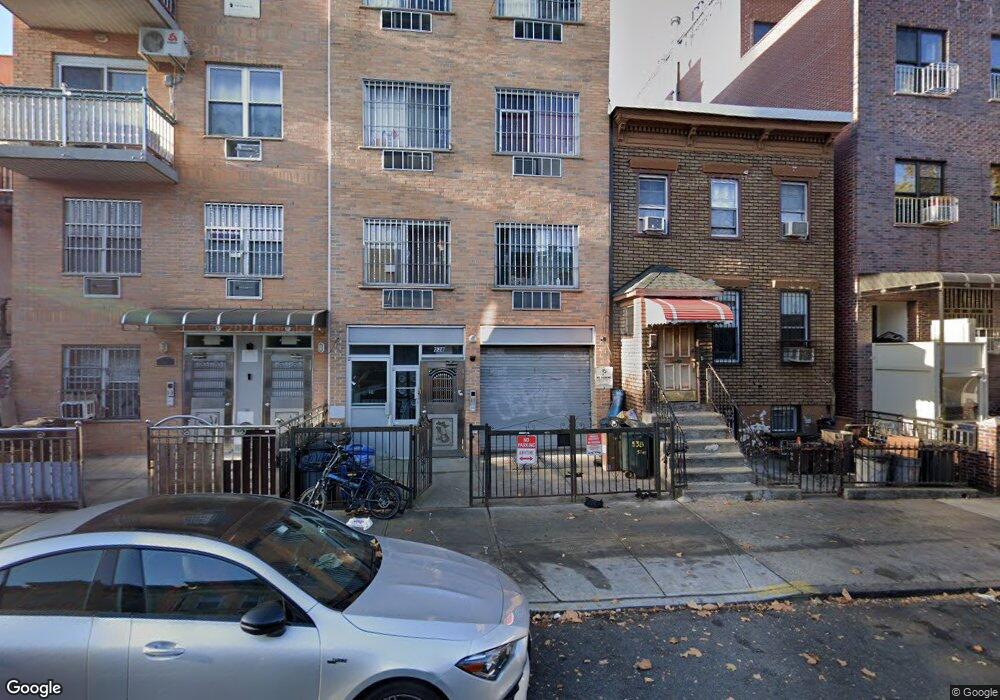
538 57th St Unit P1 Brooklyn, NY 11220
Sunset Park NeighborhoodEstimated Value: $325,000 - $586,000
Studio
--
Bath
197
Sq Ft
$2,239/Sq Ft
Est. Value
About This Home
This home is located at 538 57th St Unit P1, Brooklyn, NY 11220 and is currently estimated at $441,030, approximately $2,238 per square foot. 538 57th St Unit P1 is a home located in Kings County with nearby schools including P.S. 503: The School of Discovery, IS 220 John J. Pershing, and Fort Hamilton High School.
Ownership History
Date
Name
Owned For
Owner Type
Purchase Details
Closed on
Apr 25, 2022
Sold by
Lau Kin Chue and Lau Yu Xian
Bought by
Jiang Dong and Zhu Zai You
Current Estimated Value
Home Financials for this Owner
Home Financials are based on the most recent Mortgage that was taken out on this home.
Original Mortgage
$490,000
Outstanding Balance
$459,349
Interest Rate
5.11%
Mortgage Type
Purchase Money Mortgage
Estimated Equity
-$18,319
Purchase Details
Closed on
Apr 1, 2014
Sold by
R & Y Kings Holdings Llc
Bought by
Lau Kin Chue and Lau Yu Xian
Purchase Details
Closed on
Jan 17, 2007
Sold by
Mial Llc and % Cma Design Group
Bought by
47 East 19 Street Realty Llc
Create a Home Valuation Report for This Property
The Home Valuation Report is an in-depth analysis detailing your home's value as well as a comparison with similar homes in the area
Home Values in the Area
Average Home Value in this Area
Purchase History
We collect this data history from publicly available records. To have your information removed, we recommend requesting removal directly through your county’s website.
| Date | Buyer | Sale Price | Title Company |
|---|---|---|---|
| Jiang Dong | $700,000 | -- | |
| Lau Kin Chue | $60,840 | -- | |
| 47 East 19 Street Realty Llc | $1,700,000 | -- |
Source: Public Records
Mortgage History
We collect this data history from publicly available records. To have your information removed, we recommend requesting removal directly through your county’s website.
| Date | Status | Borrower | Loan Amount |
|---|---|---|---|
| Open | Jiang Dong | $490,000 |
Source: Public Records
Tax History
| Year | Tax Paid | Tax Assessment Tax Assessment Total Assessment is a certain percentage of the fair market value that is determined by local assessors to be the total taxable value of land and additions on the property. | Land | Improvement |
|---|---|---|---|---|
| 2026 | $405 | $27,563 | $563 | $27,000 |
| 2025 | $277 | $31,050 | $563 | $30,487 |
| 2024 | $277 | $38,813 | $563 | $38,250 |
| 2023 | $142 | $35,550 | $563 | $34,987 |
| 2022 | $20 | $35,100 | $563 | $34,537 |
| 2021 | $21 | $39,150 | $563 | $38,587 |
| 2019 | $21 | $32,648 | $563 | $32,085 |
| 2018 | $21 | $3,937 | $82 | $3,855 |
| 2017 | $21 | $3,646 | $87 | $3,559 |
| 2016 | $21 | $3,376 | $86 | $3,290 |
| 2015 | $315 | $3,126 | $103 | $3,023 |
| 2014 | $315 | $3,126 | $106 | $3,020 |
Source: Public Records
Map
Nearby Homes
Your Personal Tour Guide
Ask me questions while you tour the home.