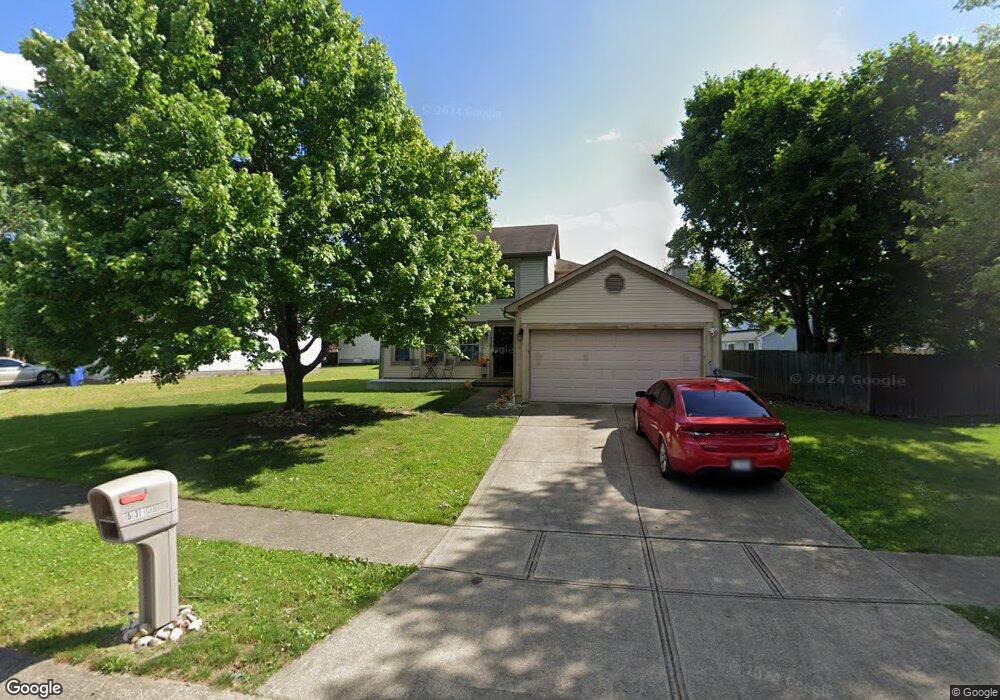
5383 Brayton Ave Columbus, OH 43232
Walnut Heights NeighborhoodEstimated Value: $267,533 - $282,000
3
Beds
3
Baths
1,508
Sq Ft
$182/Sq Ft
Est. Value
About This Home
This home is located at 5383 Brayton Ave, Columbus, OH 43232 and is currently estimated at $274,383, approximately $181 per square foot. 5383 Brayton Ave is a home located in Franklin County with nearby schools including Liberty Elementary School, Yorktown Middle School, and Independence High School.
Ownership History
Date
Name
Owned For
Owner Type
Purchase Details
Closed on
Jun 8, 2007
Sold by
Carrington Charlotte
Bought by
Farve Nichole J
Current Estimated Value
Home Financials for this Owner
Home Financials are based on the most recent Mortgage that was taken out on this home.
Original Mortgage
$115,000
Outstanding Balance
$69,033
Interest Rate
6.2%
Mortgage Type
Purchase Money Mortgage
Estimated Equity
$205,350
Purchase Details
Closed on
Oct 7, 1997
Sold by
Homewood Building Company
Bought by
Carrington Charlotte and Carrington Charlotte D
Home Financials for this Owner
Home Financials are based on the most recent Mortgage that was taken out on this home.
Original Mortgage
$112,300
Interest Rate
7.51%
Mortgage Type
FHA
Create a Home Valuation Report for This Property
The Home Valuation Report is an in-depth analysis detailing your home's value as well as a comparison with similar homes in the area
Home Values in the Area
Average Home Value in this Area
Purchase History
We collect this data history from publicly available records. To have your information removed, we recommend requesting removal directly through your county’s website.
| Date | Buyer | Sale Price | Title Company |
|---|---|---|---|
| Farve Nichole J | $115,000 | Pillar | |
| Carrington Charlotte | $112,400 | Preferred Title Agency Inc |
Source: Public Records
Mortgage History
We collect this data history from publicly available records. To have your information removed, we recommend requesting removal directly through your county’s website.
| Date | Status | Borrower | Loan Amount |
|---|---|---|---|
| Open | Farve Nichole J | $115,000 | |
| Previous Owner | Carrington Charlotte | $112,300 |
Source: Public Records
Tax History
| Year | Tax Paid | Tax Assessment Tax Assessment Total Assessment is a certain percentage of the fair market value that is determined by local assessors to be the total taxable value of land and additions on the property. | Land | Improvement |
|---|---|---|---|---|
| 2025 | $3,425 | $76,310 | $16,980 | $59,330 |
| 2024 | $3,425 | $76,310 | $16,980 | $59,330 |
| 2023 | $3,381 | $76,300 | $16,975 | $59,325 |
| 2022 | $2,244 | $43,260 | $6,300 | $36,960 |
| 2021 | $2,248 | $43,260 | $6,300 | $36,960 |
| 2020 | $2,251 | $43,260 | $6,300 | $36,960 |
| 2019 | $2,132 | $35,140 | $5,250 | $29,890 |
| 2018 | $2,142 | $35,140 | $5,250 | $29,890 |
| 2017 | $2,254 | $35,140 | $5,250 | $29,890 |
| 2016 | $2,377 | $35,880 | $5,080 | $30,800 |
| 2015 | $2,158 | $35,880 | $5,080 | $30,800 |
| 2014 | $2,163 | $35,880 | $5,080 | $30,800 |
| 2013 | $1,185 | $39,865 | $5,635 | $34,230 |
Source: Public Records
Map
Nearby Homes
- 3012 Argonne Ct
- 5423 Adderley Ave
- 5465 Argo Ln
- 5366 Adderley Ave
- 5691 Matuka Dr
- 2900 Gentry Ln
- 5882 Abernathy Ln Unit 5882F
- 5290 Quincy Dr
- 5880 Annaberg Dr
- 5361 Parkline Dr
- 2998 Osgood Rd E
- 3261 Calveylee Ln
- 3267 Calveylee Ln
- 3273 Calveylee Ln
- 3040 Wyntree Dr
- 3262 Calveylee Ln
- 3268 Calveylee Ln
- 3274 Calveylee Ln
- 5946 Abernathy Ln
- 3057 Lamptonridge Dr
- 5391 Brayton Ave
- 5375 Brayton Ave
- 3111 Crossgate Rd
- 3100 Thorndyke St
- 3108 Thorndyke St
- 3119 Crossgate Rd
- 5386 Brayton Ave
- 5392 Brayton Ave
- 5380 Brayton Ave
- 3085 Crossgate Rd
- 3116 Thorndyke St
- 5400 Brayton Ave
- 5374 Brayton Ave
- 3127 Crossgate Rd
- 3104 Crossgate Rd
- 3122 Thorndyke St
- 5368 Brayton Ave
- 3101 Thorndyke St
- 3096 Crossgate Rd
- 3112 Crossgate Rd
Your Personal Tour Guide
Ask me questions while you tour the home.