539 Killingly St Johnston, RI 02919
Killingly Street NeighborhoodEstimated Value: $769,219
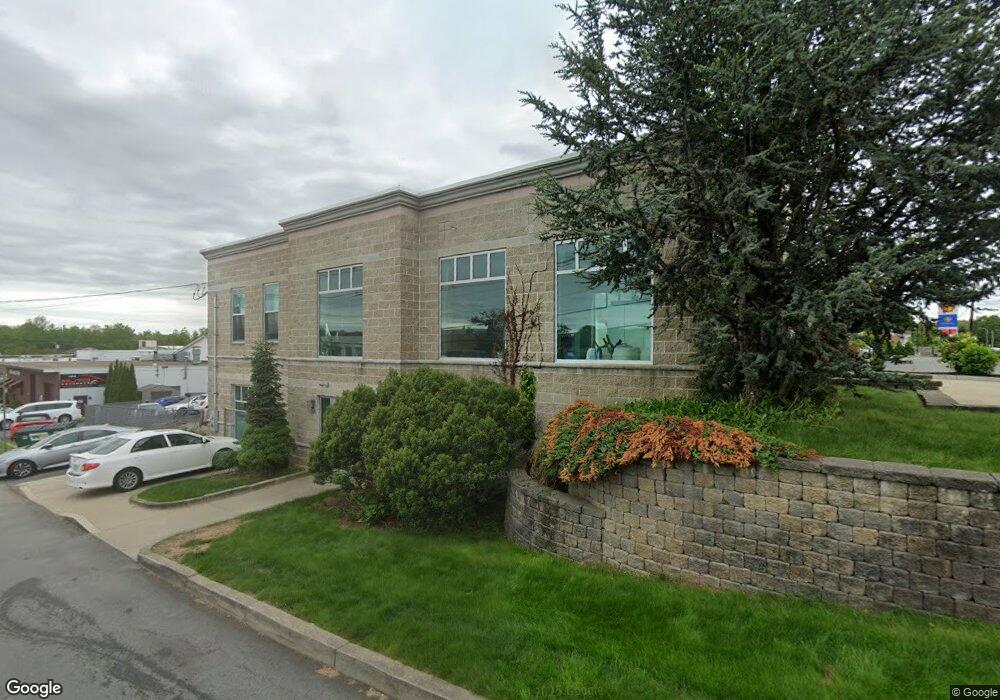
About This Home
This home is located at 539 Killingly St, Johnston, RI 02919 and is currently estimated at $769,219, approximately $220 per square foot. 539 Killingly St is a home located in Providence County with nearby schools including Johnston Senior High School, Achievement First Promesa, and Achievement First Providence Mayoral Academy Elementary School.
Ownership History
We collect this data history from publicly available records. To have your information removed, we recommend requesting removal directly through your county’s website.
Purchase Details
Purchase Details
Purchase Details
Home Values in the Area
Average Home Value in this Area
Purchase History
We collect this data history from publicly available records. To have your information removed, we recommend requesting removal directly through your county’s website.
| Date | Buyer | Sale Price | Title Company |
|---|---|---|---|
| $297,000 | -- | ||
| $297,000 | -- | ||
| -- | -- | ||
| -- | -- | ||
| $77,500 | -- | ||
| $77,500 | -- |
Mortgage History
We collect this data history from publicly available records. To have your information removed, we recommend requesting removal directly through your county’s website.
| Date | Status | Borrower | Loan Amount |
|---|---|---|---|
| Open | $506,250 | ||
| Previous Owner | $368,000 | ||
| Previous Owner | $30,000 |
Tax History
We collect this data history from publicly available records. To have your information removed, we recommend requesting removal directly through your county’s website.
| Year | Tax Paid | Tax Assessment Tax Assessment Total Assessment is a certain percentage of the fair market value that is determined by local assessors to be the total taxable value of land and additions on the property. | Land | Improvement |
|---|---|---|---|---|
| 2025 | $11,170 | $399,200 | $134,400 | $264,800 |
| 2024 | $10,950 | $399,200 | $134,400 | $264,800 |
| 2023 | $10,950 | $399,200 | $134,400 | $264,800 |
| 2022 | $10,234 | $361,100 | $121,900 | $239,200 |
| 2021 | $10,234 | $361,100 | $121,900 | $239,200 |
| 2018 | $9,374 | $341,000 | $116,200 | $224,800 |
| 2016 | $12,402 | $341,000 | $116,200 | $224,800 |
| 2015 | $7,343 | $253,300 | $116,200 | $137,100 |
| 2014 | $7,282 | $253,300 | $116,200 | $137,100 |
| 2013 | $7,282 | $253,300 | $116,200 | $137,100 |
Map
- 514 Killingly St
- 78 Cedar St
- 35 N Long St
- 59 N Williams St
- 105 Borden Ave
- 19 S Long St
- 16 Homestead Ave
- 0 Hedley Ave
- 00 Hedley Ave
- 50 Hedley Ave
- 14 S Fairview St
- 18 Pleasant View Ave
- 97 Victor Ave
- 6 Flanders St
- 121 Barbara St
- 78 Highland Ave
- 963 Hartford Ave
- 29 Calumet Ave
- 28 City View Pkwy
- 66 Ophelia St
- 2 Oakdale Ave
- 21 Oakdale Ave
- 1 Maribeth Dr
- 2 Maribeth Dr
- 542 Killingly St
- 6 Sunnyside Ave
- 518 Killingly St
- 25 Oakdale Ave
- 521 Killingly St
- 26 Oakdale Ave Unit A
- 26 Oakdale Ave Unit B
- 555 Killingly St
- 3 Maribeth Dr
- 4 Maribeth Dr
- 516 Killingly St
- 0 Sunnyside Ave
- 9 Ray St
- 556 Killingly St
- 554 Killingly St
- 28 Oakdale Ave
Ask me questions while you tour the home.