539 Middle St Braintree, MA 02184
East Braintree NeighborhoodEstimated Value: $934,295 - $1,857,000
About This Home
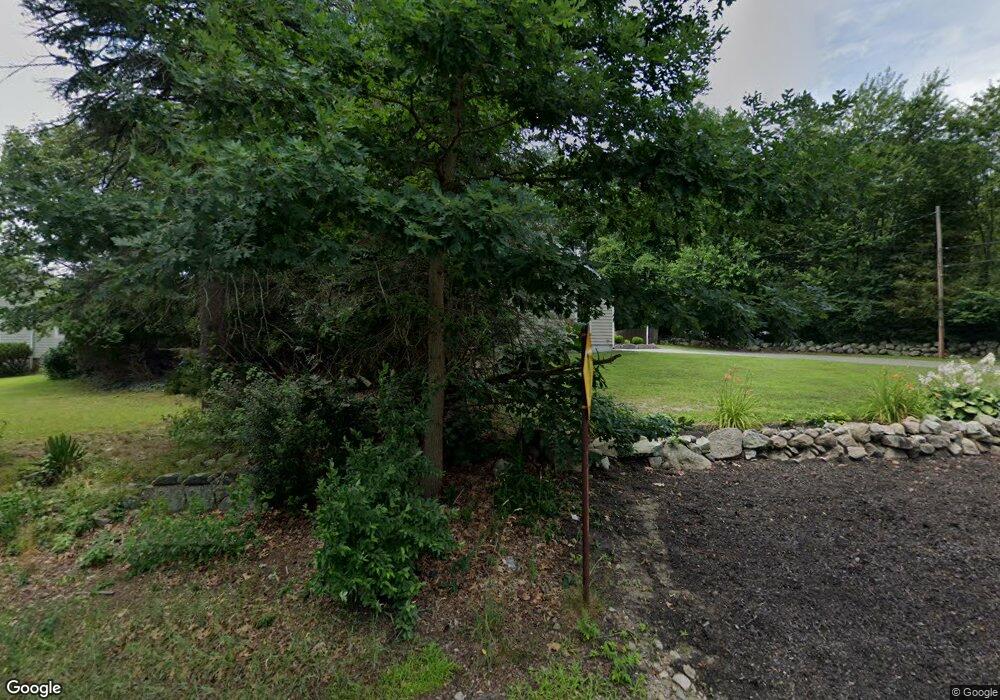
This home is located at 539 Middle St, Braintree, MA 02184 and is currently estimated at $1,191,074, approximately $439 per square foot. 539 Middle St is a home located in Norfolk County with nearby schools including Braintree High School, Step Ahead Kindergarten, and Sacred Heart Elementary School.
Ownership History
We collect this data history from publicly available records. To have your information removed, we recommend requesting removal directly through your county’s website.
Purchase Details
Purchase Details
Purchase Details
Home Values in the Area
Average Home Value in this Area
Purchase History
We collect this data history from publicly available records. To have your information removed, we recommend requesting removal directly through your county’s website.
| Date | Buyer | Sale Price | Title Company |
|---|---|---|---|
| -- | -- | ||
| -- | -- | ||
| $280,000 | -- | ||
| $280,000 | -- |
Mortgage History
We collect this data history from publicly available records. To have your information removed, we recommend requesting removal directly through your county’s website.
| Date | Status | Borrower | Loan Amount |
|---|---|---|---|
| Previous Owner | $378,000 |
Tax History
We collect this data history from publicly available records. To have your information removed, we recommend requesting removal directly through your county’s website.
| Year | Tax Paid | Tax Assessment Tax Assessment Total Assessment is a certain percentage of the fair market value that is determined by local assessors to be the total taxable value of land and additions on the property. | Land | Improvement |
|---|---|---|---|---|
| 2025 | $9,088 | $910,600 | $395,500 | $515,100 |
| 2024 | $8,187 | $863,600 | $371,500 | $492,100 |
| 2023 | $7,820 | $801,200 | $335,600 | $465,600 |
| 2022 | $7,733 | $777,200 | $311,600 | $465,600 |
| 2021 | $7,230 | $726,600 | $287,600 | $439,000 |
| 2020 | $6,929 | $702,700 | $263,700 | $439,000 |
| 2019 | $6,625 | $656,600 | $263,700 | $392,900 |
| 2018 | $6,500 | $616,700 | $239,700 | $377,000 |
| 2017 | $6,194 | $576,700 | $215,700 | $361,000 |
| 2016 | $5,841 | $532,000 | $191,800 | $340,200 |
| 2015 | $5,622 | $507,900 | $181,000 | $326,900 |
| 2014 | $5,431 | $475,600 | $172,600 | $303,000 |
Map
- 363 Liberty St
- 590 Liberty St
- 20 Cherry Ln
- 3 Harrison Ave
- 31-33 Fountain St
- 62 Fountain St
- 27 Cindy Ln
- 414 John Mahar Hwy Unit 209
- 414 John Mahar Hwy Unit 303
- 422 John Mahar Hwy Unit 103
- 82 Lester Ln
- 51 Faxon St
- 296 Commercial St Unit 21
- 50 Sherricks Farm Rd
- 55 Hobart Ave
- 37 Lantern Ln
- 41 Lantern Ln
- 1201 Matthew Woods Dr Unit 1201
- 153 Commercial St Unit 5
- 229 Summer St
- 551 Middle St
- 531 Middle St Unit 533
- 531-533 Middle St Unit 1
- 531-533 Middle St
- 561 Middle St
- 550 Middle St
- 529 Middle St
- 536 Middle St Unit 1
- 536 Middle St
- 536 Middle St
- 536 Middle St Unit 536
- 567 Middle St
- 515 Middle St
- 15 Andrea Dr
- 540 Middle St
- 1 Marinelli Ct
- 572 Middle St
- 507 Middle St
- 516 Middle St
- 505 Middle St
Ask me questions while you tour the home.