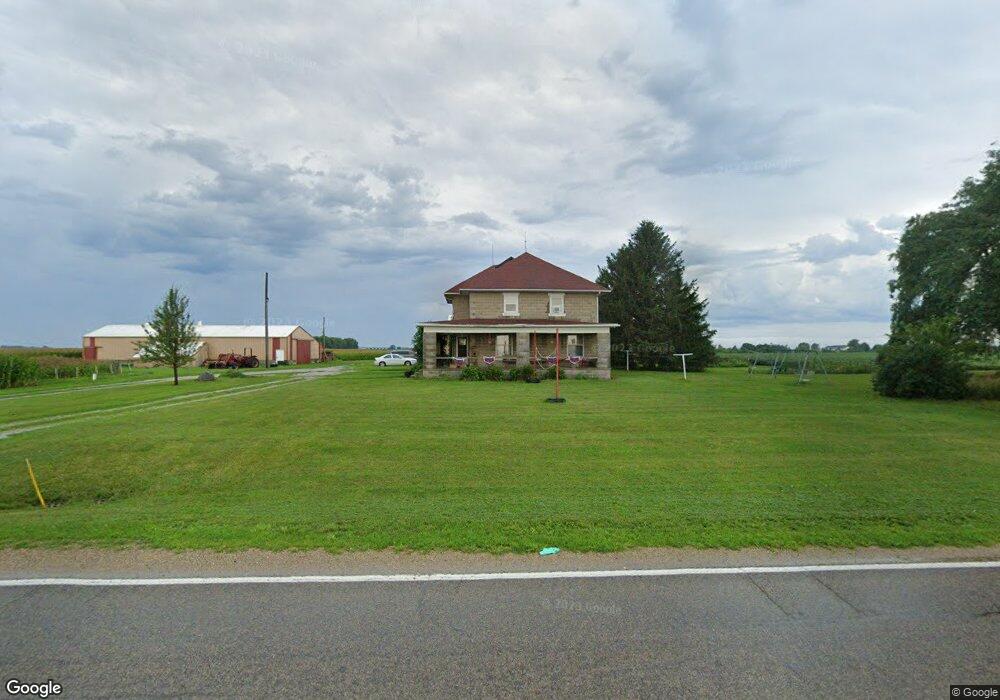
5397 E 2050 North Rd Carlock, IL 61725
Estimated Value: $150,000 - $267,000
4
Beds
1
Bath
1,150
Sq Ft
$178/Sq Ft
Est. Value
About This Home
This home is located at 5397 E 2050 North Rd, Carlock, IL 61725 and is currently estimated at $204,842, approximately $178 per square foot. 5397 E 2050 North Rd is a home located in McLean County with nearby schools including Olympia High School.
Ownership History
Date
Name
Owned For
Owner Type
Purchase Details
Closed on
May 23, 2007
Sold by
Kath Joyce A
Bought by
Kath Michael L and Kath Annette
Current Estimated Value
Home Financials for this Owner
Home Financials are based on the most recent Mortgage that was taken out on this home.
Original Mortgage
$120,000
Outstanding Balance
$73,191
Interest Rate
6.22%
Estimated Equity
$131,651
Create a Home Valuation Report for This Property
The Home Valuation Report is an in-depth analysis detailing your home's value as well as a comparison with similar homes in the area
Purchase History
| Date | Buyer | Sale Price | Title Company |
|---|---|---|---|
| Kath Michael L | $120,000 | None Available |
Source: Public Records
Mortgage History
| Date | Status | Borrower | Loan Amount |
|---|---|---|---|
| Open | Kath Michael L | $120,000 |
Source: Public Records
Tax History
| Year | Tax Paid | Tax Assessment Tax Assessment Total Assessment is a certain percentage of the fair market value that is determined by local assessors to be the total taxable value of land and additions on the property. | Land | Improvement |
|---|---|---|---|---|
| 2024 | $3,291 | $53,459 | $28,845 | $24,614 |
| 2022 | $3,291 | $44,884 | $24,218 | $20,666 |
| 2021 | $3,081 | $42,216 | $22,778 | $19,438 |
| 2020 | $2,981 | $41,006 | $22,125 | $18,881 |
| 2019 | $2,946 | $40,774 | $22,000 | $18,774 |
| 2018 | $2,234 | $32,223 | $13,449 | $18,774 |
| 2017 | $2,207 | $32,043 | $13,374 | $18,669 |
| 2016 | $2,192 | $32,043 | $13,374 | $18,669 |
| 2015 | $2,129 | $31,225 | $13,033 | $18,192 |
| 2014 | $1,949 | $31,225 | $13,033 | $18,192 |
| 2013 | -- | $31,225 | $13,033 | $18,192 |
Source: Public Records
Map
Nearby Homes
- 305 S Perry St
- 16 Boulder Dr
- 14 Boulder Dr
- 12 Boulder Dr
- 15 Boulder Dr
- 9 Boulder Dr
- 7 Boulder Dr
- 4 Sandstone Ave
- 4 Cobblestone Ave
- 1 Cobblestone Ave
- 107 E Washington St
- 9993 US Highway 150
- 220 Deer Lakes Dr
- 2012 County Road 600 N
- 122 E Fisk St
- 14735 Lunar Dr
- 33987 Conley Rd
- 9491 Crossbow Dr
- 2215 County Road 600 N
- 14030 Lara Trace
- 5150 E 2050 North Rd
- 20155 N 500 East Rd
- 20161 N 500 East Rd
- 20232 N 500 East Rd
- 20522 N 600 East Rd
- 20522 N 600 East Rd
- 20950 N 500 East Rd
- 20814 N 600 East Rd
- 4552 E 2050 North Rd
- 21226 N 500 East Rd
- 5252 E 1950 North Rd
- 21262 N 500 East Rd
- 21192 N 500 East Rd
- 21192 N 500 East Rd
- 21164 N 600 East Rd
- 21149 N 600 East Rd
Your Personal Tour Guide
Ask me questions while you tour the home.