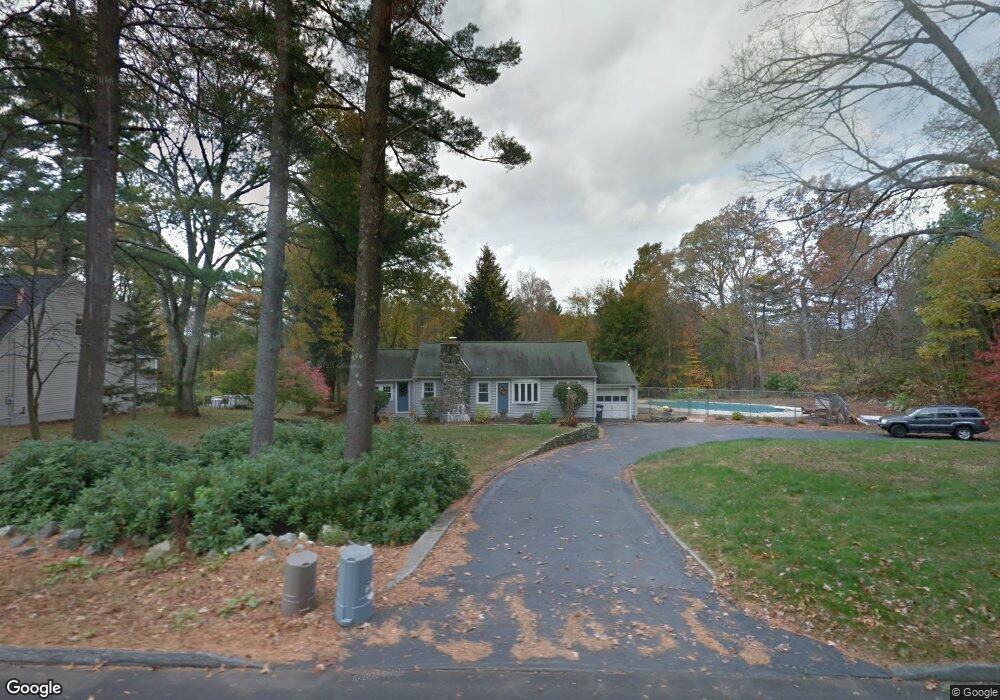
54 Brigham St Northborough, MA 01532
Estimated Value: $590,222 - $678,000
3
Beds
2
Baths
1,408
Sq Ft
$442/Sq Ft
Est. Value
About This Home
This home is located at 54 Brigham St, Northborough, MA 01532 and is currently estimated at $622,556, approximately $442 per square foot. 54 Brigham St is a home located in Worcester County with nearby schools including Marguerite E. Peaslee Elementary School, Robert E. Melican Middle School, and Algonquin Regional High School.
Ownership History
Date
Name
Owned For
Owner Type
Purchase Details
Closed on
Aug 11, 2000
Sold by
Lorenzi David D and Lorenzi Pamela J
Bought by
Eckler Barry J and Eckler Michelle L
Current Estimated Value
Purchase Details
Closed on
Oct 1, 1991
Sold by
Minardi Rt
Bought by
Lorenzi David D and Pamela Lorenzi
Create a Home Valuation Report for This Property
The Home Valuation Report is an in-depth analysis detailing your home's value as well as a comparison with similar homes in the area
Home Values in the Area
Average Home Value in this Area
Purchase History
| Date | Buyer | Sale Price | Title Company |
|---|---|---|---|
| Eckler Barry J | $247,813 | -- | |
| Lorenzi David D | $137,000 | -- |
Source: Public Records
Mortgage History
| Date | Status | Borrower | Loan Amount |
|---|---|---|---|
| Open | Lorenzi David D | $240,000 | |
| Closed | Lorenzi David D | $25,000 |
Source: Public Records
Tax History
| Year | Tax Paid | Tax Assessment Tax Assessment Total Assessment is a certain percentage of the fair market value that is determined by local assessors to be the total taxable value of land and additions on the property. | Land | Improvement |
|---|---|---|---|---|
| 2025 | $7,912 | $555,200 | $284,300 | $270,900 |
| 2024 | $6,833 | $478,500 | $225,500 | $253,000 |
| 2023 | $6,827 | $461,600 | $213,900 | $247,700 |
| 2022 | $6,690 | $405,700 | $204,700 | $201,000 |
| 2021 | $6,434 | $375,800 | $187,900 | $187,900 |
| 2020 | $6,453 | $374,100 | $187,900 | $186,200 |
| 2019 | $6,201 | $361,600 | $186,900 | $174,700 |
| 2018 | $5,751 | $330,700 | $174,400 | $156,300 |
| 2017 | $5,542 | $318,700 | $174,400 | $144,300 |
| 2016 | $5,371 | $312,800 | $171,000 | $141,800 |
| 2015 | $5,282 | $315,700 | $179,300 | $136,400 |
| 2014 | $5,075 | $305,900 | $179,300 | $126,600 |
Source: Public Records
Map
Nearby Homes
- 59 School St Unit B-12
- 106 School St
- 2 Sterling Ct
- 5 Swan View Common Dr
- 84 Ridge Rd
- 6 Silas Dr
- 11 Patriot Dr
- 43 Whitney St
- 125 Rice Ave
- 9 Bryant Ln
- 129 Bartlett St
- 15 Dunia Ln Unit 15
- 39 Pleasant St Unit A6
- 39 Pleasant St Unit A17
- 39 Pleasant St Unit B4
- 19 Crestwood Dr Unit 19
- 26 Treetop Cir
- 26 John Edward Dr
- 10 Sawyer Rd
- 11 Juniper Brook Rd
Your Personal Tour Guide
Ask me questions while you tour the home.